Measures of Center and Variability
Dot Plots
Box Plots
Samples and Populations
Mixed Review
100
List the three measures of center.
Mean, Median and Mode
100
How many students have between 2-4 cousins?

9 students
100
What percentage of chickens laid more than 3 eggs?

75%
100
I want to know how many chores 7th graders at Hayes do per week.
What is the Population?
7th graders at Hayes
100
Part A: Which ski resort had the most consistent snowfall?
Part B: How do you know?

Part A: Powder Valley
Part B: IQR and Range are smaller (closer together)
200
List the three measures of variability.
Range, IQR, MAD
200
Find the mean:

Mean = 2
200

Part A: What is the IQR?
Part B: What is the Range?
IQR= 5
Range= 8
200
Part A: I want to know how many chores 7th graders at Hayes do per week. If I ask every 10th student on the Bobcat's roster - is this sample representative?
Part B: Why?
Part A: NO
Part B: Only 6th graders would be asked - should be 7th graders (Wildcats).
200
4 students ride bus number 872 in Donahue’s 7th hour which includes 24 students. If there are 288 students in the 7th grade how many would ride bus 872?
48 students
300
Part A: Which class scored better?
Part B: What measure of center is on a box plot?

Part A: CLASS A did better.
Part B: MEDIAN is on a box plot
300
True or False:
Most 7th graders do less than 5 chores.

False, most 7th graders do more than 5 chores.
300
Part A: Which box plot shows more variability?
Part B: How do you know?

Part A: Bus
Part B: The IQR/range is larger (more spread out).
300
Mr. Hoskins wants to know what reward the 8th graders want at graduation. Select all that representative samples:
A) Poll everyone over 5 foot 10 inches
B) Assign every 8th grader a number and pick 25 random numbers.
C) Put all 7th grader’s names in a hat, then draw 25 out randomly
D) Pick 5 random students from each of the 8th grade teachers’ classrooms
E) Ask Ms. Sizemore’s class
B and D
300
Part A: Which class had the most consistent scores?
Part B: How do you know?

Part A: 3rd hour
Part B: Lowest MAD
400
Part A: Which store has more variation pricing?
Part B: What measures of variations are on a box and whisker?
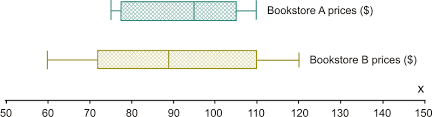
Part A: BOOKSTORE B has more variation.
Part B: IQR and RANGE.
400
What is the mean and median?

Mean = 3
Median = 3
400
Generally, which method of transport takes more time?

Riding the bus.
400
I want to know the average time a seventh grader at EJH spends playing basketball. I ask the basketball team how much time they spend playing basketball.
Is this a representative sample? Why?
NO, didn’t include people not on the basketball team.
Also, the basketball team is more likely to play basketball.
400
If 5 out of 25 kids are planning of going to summer camp this summer - how many kids out of 150 would be expected to go to camp?
30 kids
500

Part A: Which class did better on the exam?
Part B: Which class has scores are more spread out?
Part A: 2nd period did better.
Part B: 5th period’s scores are more spread out
500
Infer which team is better based on points scored:

TEAM B is probably the better team - they score more points than team A.
500
Part A: Which team’s scores are more consistent?
Part B: How do you know?

Part A: Team A
Part B: Range/IQR is smaller (data is close together)
500
Ms. Morgan wants to choose random people from her track team - what method is representative?
A) 5 female runners
B) Students that jump hurdles
C) Every 5th student that shows up to practice
D) 10 random 6th graders
C) Every 5th student that shows up to practice
Includes all grades and is fair and random.
500
Sketch a box plot of this data.
4, 5, 8, 9, 10, 12, 15, 15, 15
What is strange about this box plot?
There is no right whisker