Pictographs and Bar Graphs
Tables and Pictographs
bar graphs
Line Plots
Solve Problems
100
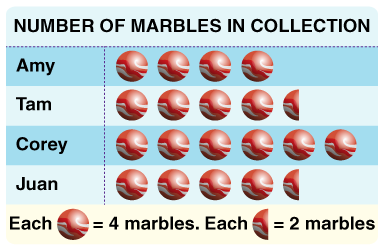
Who has the fewest marbles?
Corey
Tam
Amy
Juan
Amy
100
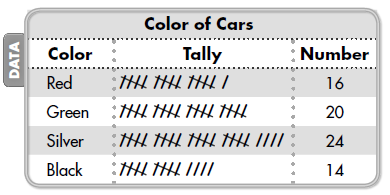
Students recorded the colors of cars parked in the parking lot. They displayed the data in the frequency table. They want to make a pictograph for the data. They will use the symbol 
4 symbols
100
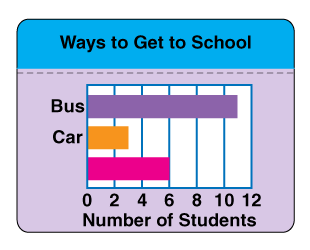
What information is needed to complete the bar graph?
A. Number of Students who ride the bus to school
B. Number of students who ride in a car to school
C. The way exactly 3 students get to school
D. The way exactly 6 students get to school
D
100
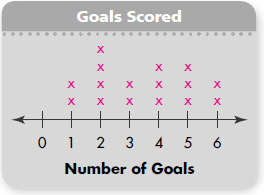
Coach Tom records the number of goals his soccer team scores in each game during a season. In how many games did the team score 4 goals?
3 games
100

Which statement is true about the data in the graphs?
A. A total of 18 students in each class own cats
B. More students in grade 4 than in grade 3 own cats
C. Most students in both grades own cats
D. More students in grade 4 than in grade 3 own birds
A. A total of 18 students in each class own cats
200
How many more marbles does Corey have than Tam?
10
5
6
4
6
200
Students recorded the colors of cars parked in the parking lot. They displayed the data in the frequency table. They want to make a pictograph for the data. They will use the symbol 
2 cars
200
Lisa practiced throwing a football. Her coach measured the distance it flew in the air for 25 throws. The longest distance was 32 meters. The shortest distance was 17 meters. How many more meters is the longest distance than the shortest distance?
15 meters
200
Coach Tom records the number of goals his soccer team scores in each game during a season. How many games did the team play this season?
16 games
200
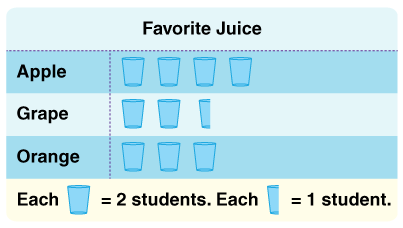
How many more students voted for apple juice than for grape juice?
3 more students
300
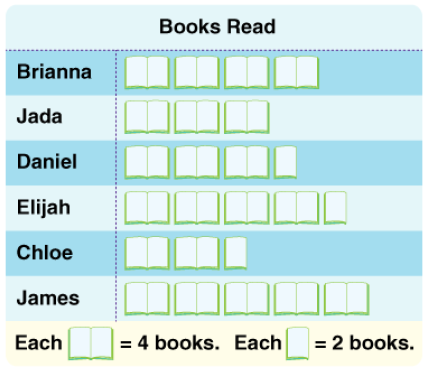
How many more books were read by James and Elijah than by Jade and Chloe?
16
300
Students recorded the colors of cars parked in the parking lot. They displayed the data in the frequency table. They want to make a pictograph for the data. They will use the symbol
Black
300
Tim made a bar graph to record the favorite fruit of each of his classmates. Each grid line represents 2 people. Orange was chosen by 11 people. The bar for apple is 4 grid lines higher than the bar for orange. How many people chose apple?
19 people
300
Coach Tom records the number of goals his soccer team scores in each game during a season. The team played one more game and scored 1 goal. Where should Coach Tom put the X for this game?
Above the 1
300
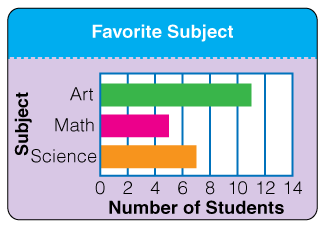
How many fewer students voted for art than for math and science combined?
1 fewer student
400
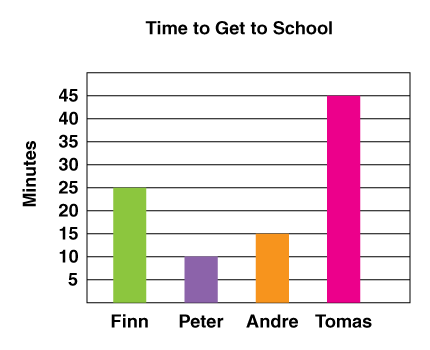
Which Student takes the most time to go to school?
Tomas
400
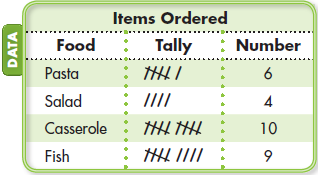
A chef at a café recorded the items ordered for lunch one day. She wants to display the data in a pictograph. She will use the symbol 
3 symbols
400
What is Ms. Ferguson's favorite color
Green
400

The ages of the members of a chess team are displayed in the line plot. How many team members are 8 years old?
4 members
400
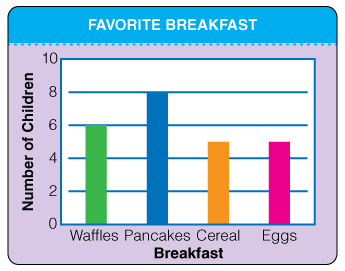
How many more children chose pancakes than waffles?
2
500
How many fewer minutes does it take Andre to get to school than Finn and Peter combined?
20 minutes
500
A chef at a café recorded the items ordered for lunch one day. She wants to display the data in a pictograph. She will use the symbol 
Fish
500
What is Ms. Ferguson's 2 favorite foods?
Mexican food and Sushi
500
The ages of the members of a chess team are displayed in the line plot. A new member who is 7 years old joins the team. Where should the team put the X for the new member?
Above the 7
500
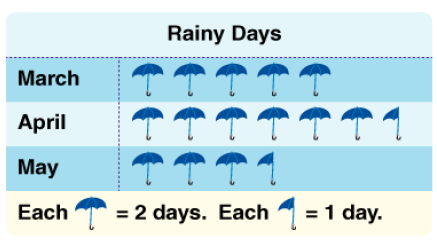
Select all the true statements
A. There were 2 more rainy days in April than in May.
B. It rained for 30 days altogether in March, April, and May
C. There were 3 fewer rainy days in May than in March.
D. It rained more days in April than in March and May combined.
B and C are correct