MEAN, MEDIAN & MODE
RANGE & IQR
TYPES OF DATA
GRAPHS & DISPLAYS
OUTLIERS & INTERPRETING
100
Find the mean of: 4, 6, 8, 10, 12
8
100
Find the range of: 5, 9, 12, 20, 27
22
(27 − 5)
100
(Double Points) Is ‘number of pets owned’ categorical or numerical data?
Numerical
(more precisely, discrete numerical — you count it)
100
Which type of graph displays categorical data using separate bars with gaps between them?
A bar graph
(also called a bar chart or column graph)
100
What is an outlier?
A data value that is much larger or much smaller than the rest of the data — it sits well away from the main cluster.
200
Find the median of: 3, 7, 8, 11, 14, 21, 25
11
(the 4th value — the middle of 7 values
200
(Double points)What does IQR stand for, and what is the formula for it?
Interquartile Range
IQR = Q3 − Q1
200
Eye colour is categorical data. Is it nominal or ordinal, and why?
Nominal
The categories (blue, brown, green…) have no natural order or ranking.
200
Give TWO differences between a bar graph and a histogram.
1. Bar graph shows categorical data; a histogram shows numerical data grouped into intervals.
2. Bar graph bars have gaps; histogram bars touch.
3. Histogram bars must stay in numerical order; bar graph bars can be rearranged.
(Any two of the above.)
200
In the data set 12, 14, 15, 16, 78 — which value is the outlier, and which measure of centre does it affect the most?
78 is the outlier.
It affects the mean the most: the mean jumps to 27, while the median stays at 15.
300
Find the median of: 12, 15, 9, 20, 18, 11
13.5
Order them first: 9, 11, 12, 15, 18, 20
→ (12 + 15) ÷ 2 = 13.5
300
Find Q1 and Q3 for: 2, 4, 5, 7, 9, 11, 13, 16
Q1 = 4.5 and Q3 = 12
Lower half 2, 4, 5, 7 → 4.5
Upper half 9, 11, 13, 16 → 12
300
Is ‘height measured in centimetres’ discrete or continuous
Continuous
300
For the dot plot shown, find the mode and the median.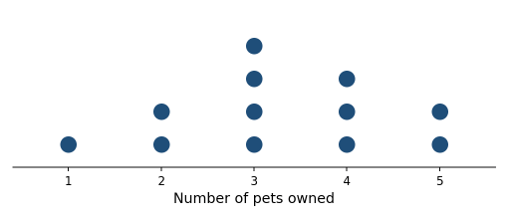
Mode = 3 and Median = 3
There are 12 data values, so the median is halfway between the 6th and 7th values — both are 3.
300
(Double points) Which measure of CENTRE and which measure of SPREAD are least affected by outliers?
The median (centre) and the IQR (spread).
Both ignore the extreme values, so we say they are resistant to outliers.
400
A set of 5 numbers has a mean of 14. Four of the numbers are 10, 12, 16 and 20. What is the fifth number?
12
Total must be 5 × 14 = 70.
70 − 58 = 12
400
Find the IQR of: 3, 5, 6, 8, 10, 12, 14, 15, 18
IQR = 9
Median = 10 (leave it out)
Q1 = 5.5, Q3 = 14.5
14.5 − 5.5 = 9
400
T-shirt sizes are recorded as S, M, L, XL. Fully classify this type of data.
Categorical ordinal
The categories have a natural order (small → extra large), but no numerical value.
400
(Double Points)For the histogram shown, how many students are in the data set, and which interval contains the median?
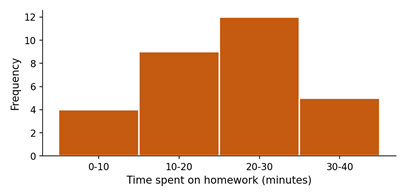
30 students
The median sits between the 15th and 16th values. Cumulative totals are 4, 13, 25, 30, so the median is in the 20–30 minute interval.
400
Test scores: 55, 58, 60, 62, 64, 65, 95
Find the mean and the median, then say which one better represents the class.
Mean ≈ 65.6 and Median = 62
The median is the better representation: the outlier 95 drags the mean above all but one of the other scores.
500
(Double Points)The mean of 8 numbers is 21. One number is removed, and the mean of the remaining 7 numbers is 22. What number was removed?
14
8 × 21 = 168
7 × 22 = 154
168 − 154 = 14
500
A data set has Q1 = 24 and Q3 = 40. Using the 1.5 × IQR rule, which of these values are outliers?
65 5 45 70
65 and 70
IQR = 16, so 1.5 × IQR = 24.
Lower fence = 24 − 24 = 0
Upper fence = 40 + 24 = 64
Only 65 and 70 fall outside the fences.
500
Fully classify each of these:
(a) postcode
(b) time taken to run 100 m
(c) number of siblings
(d) star rating out of 5
(a) Categorical nominal — numbers used as labels
(b) Numerical continuous
(c) Numerical discrete
(d) Categorical ordinal
(All four needed for the points.)
500
A distribution (graph) has a long tail stretching out from it to the right. Name this shape, and state whether the mean or the median will be larger.
Positively skewed (skewed to the right)
The mean is larger than the median, because the high values in the tail drag the mean upwards
500
Class A and Class B both have a median mark of 70. Class A has an IQR of 4; Class B has an IQR of 20. What does this tell you, and which class is more consistent?
Both classes have the same typical (middle) mark.
Class A’s middle 50% of marks are packed within 4 marks, while Class B’s are spread over 20 marks.
Class A is far more consistent; Class B has much more variability.