Stem & Leaf
Box Plot
Mixed Graphs
Scatterplots
Mean, Median, Mode, Range
100
Which group had the higher maximum test score?
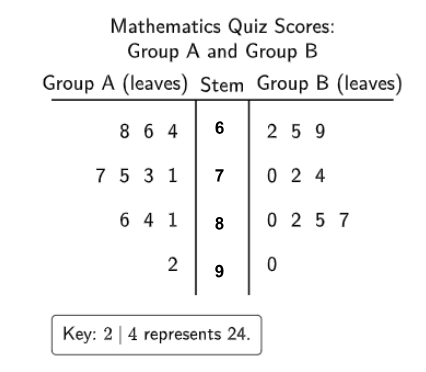
Group A
100
What is the IQR?
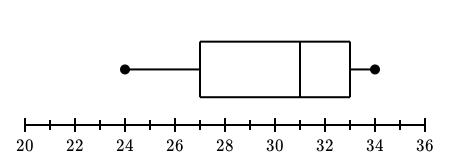
IQR = 6
100
Which Group had the higher IQR?
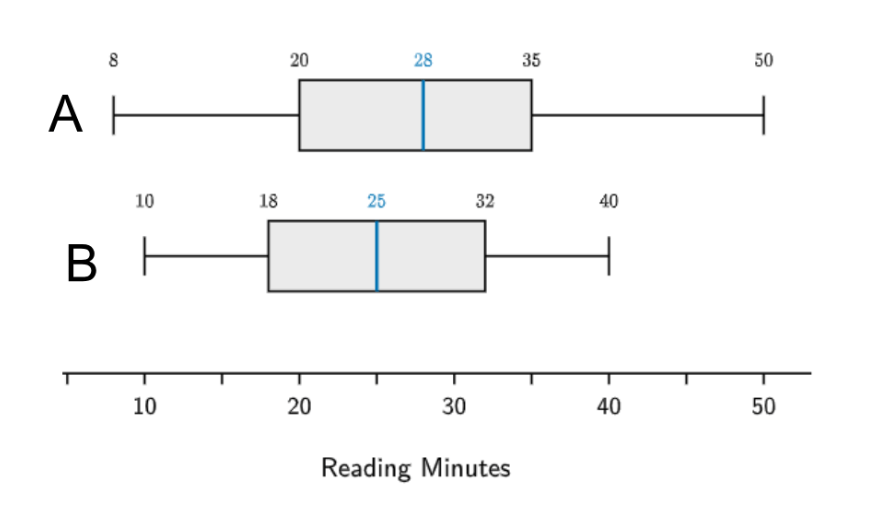
Group A
100
What type of Correlation?
Positive, Negative, No Correlation, Non-linear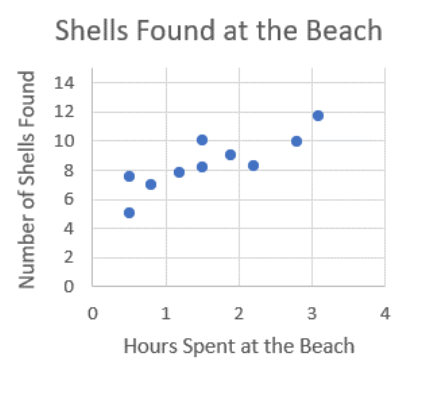
Positive
100
Determine the range of the data
2, 3, 5, 7, 8, 10, 11, 11, 13, 15, 17, 18
Range = 16
200
Write the list of low temperatures.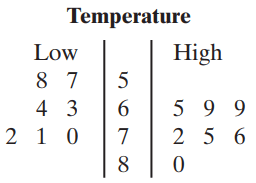
57, 58, 63, 64, 70, 71, 72
200
Which car had the higher median?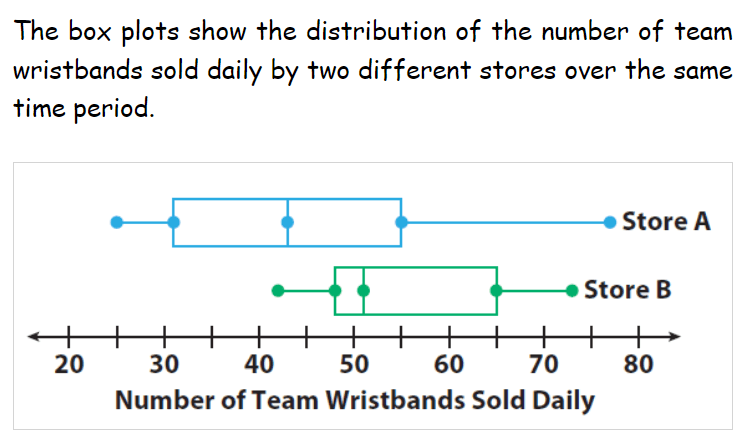
Store B
200
Based on the line graphs, which statement is true?
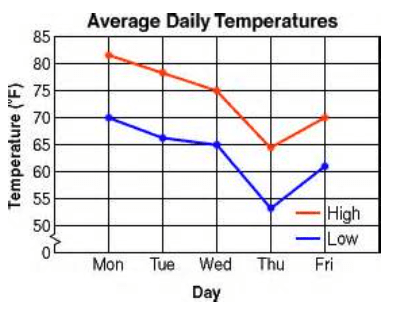
A. The high on Monday and low on Friday were the same.
B. The low on Monday and high on Friday were the same.
C. The low on Tuesday and high on Thursday were the same.
B
200
As Tommy's hours studying increases, his number of mistakes ___________________.
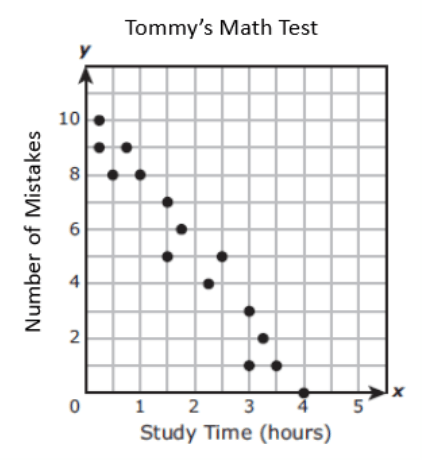
Decreases
200
What is the IQR (interquartile range) of the following data?
3, 8, 10, 4, 13, 15, 2
10
300
Who scored the greater median amount of points?
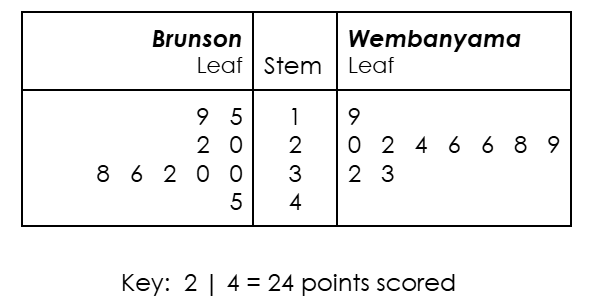
Brunson
300
Who typically spent more time doing homework?
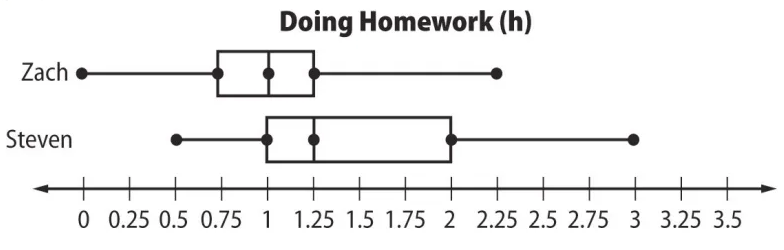
Steven because his median time spent doing homework is higher
300
True or False? 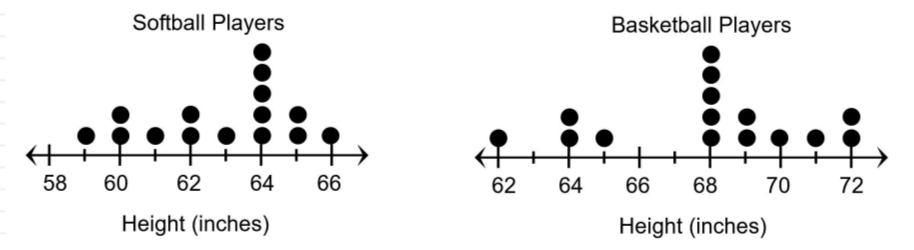
The median of the data for the heights of softball players is greater than the median of the data for the heights of basketball players.
False
300
Which statement BEST describes the relationship between elevation and temperature?
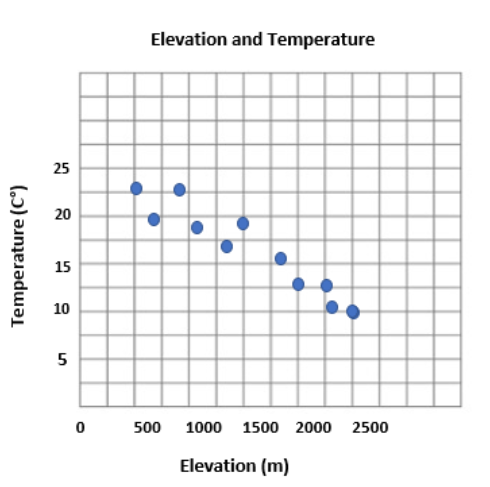
A. As the elevation increases, the temperature increases.
B. As the elevation increases, the temperature decreases.
C. There is no correlation
B. As the elevation increases, the temperature decreases.
300
Which graph has the lower mean?
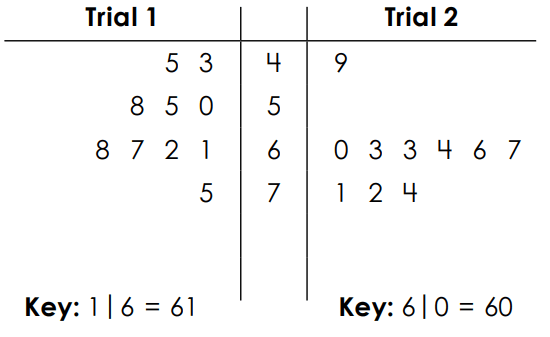
Trial 1
400
Which group had the higher median?
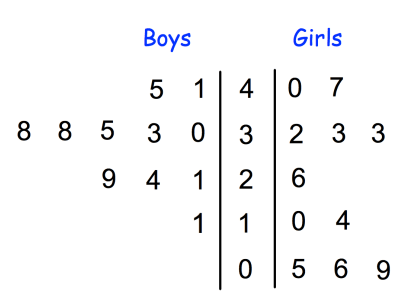
Girls
400
Which city had the higher range of temperatures?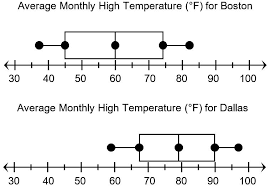
Boston
400
Which trial had more scores over 50?
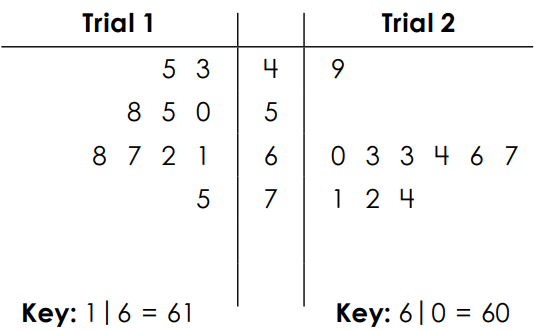
Trial 2
400
The scatter plot shows the height of a candle as it burns. Complete the statement for the scatterplot.
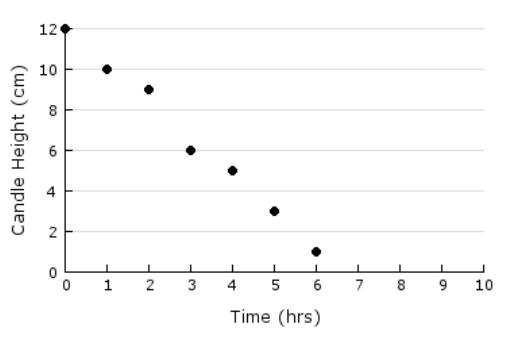
The correlation between the height of the candle and the number of hours burned is _______( positive or negative) because as the x values increase, the y values _________ (increase/decrease).
negative, decrease
400
Consider the following data:
1, 80, 83, 95, 100, 89
If the outlier is removed, what will happen to the mean?
"The mean will ___________ (increase/decrease) by _____________(12.3, 14.8, 13.9, 15)."
The mean will increase by about 14.8
500
Which orchard has the higher median weight?
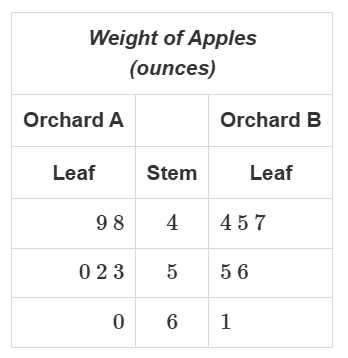
KEY: 4 | 8 = 4.8 ounces
Orchard B
500
Which group had the lowest median test score?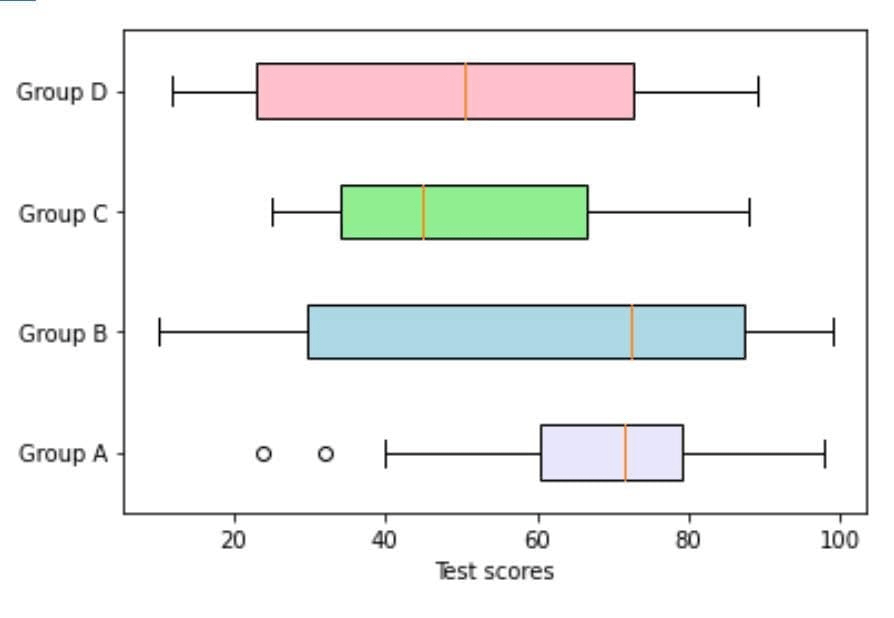
Group C
500
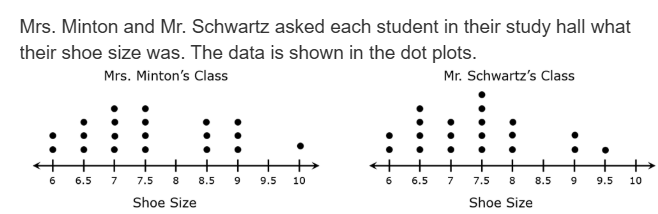 Which statement is false?
A. The median for Mr. Schwartz’s class is greater than the median for Mrs. Minton’s class.
B. The range for Mr. Schwartz’s class is less than the range for Mrs. Minton’s class.
A is false. The median is the same
500
Which statement below is an accurate interpretation of the data? 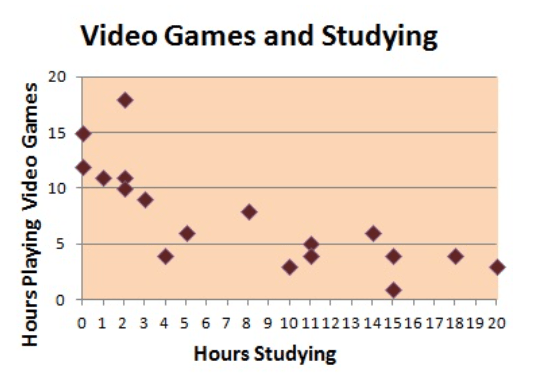
A. Students who played fewer hours on video games generally studied more.
B. Students who play more video games tend to study more.
C. There is no association with time spent on video games and hours studying.
A.
500
Which measure of center should you use and why?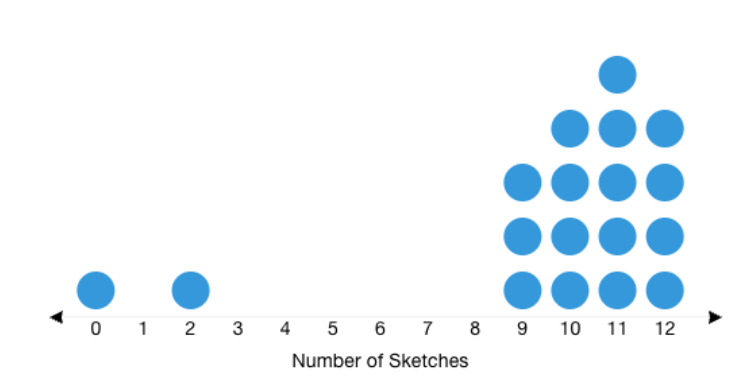
a. mode because it is the most common
b. mean because it is the best
c. median because there are outliers
c. median because there are outliers