Bar Graph
Picture graph
Miscellaneous
100
 How many children like red?
9
100

How many people say their favorite fruit is an apple?
What is 10 people?
100
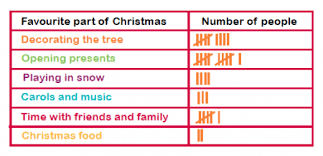
How many people liked "time with friends and family?"
What is 6?
200

How many people own both a rabbit and cat?
What is 15 people?
200

How many apples were sold in February?
What is 40 apples?
200
Go up to the board, and correctly draw 17 tallies.

300
True or False: The bars on a graph can be vertical or horizontal.
True
300
How many people liked the color green?
What is 11?
300
What are different graphs we have learned about?
picture graph, tally chart, line plot and bar graph
400

How many more students are in 1st and 4th grade combined, than in third grade?
What is 90 students?
400
How do you use the key on a pictograph?
You use it to tell you how many for each item.
For example
apple = 2 apples
400
How many do tallies do you draw for each bundle? What does it look like?
Explain and draw it.
5 tallies per group
Draw 4 lines and one across on a diagonal.
500
Go up to the board and accurately draw the bar graph, making sure to label.

(add bars)
500
How many more students liked hockey and baseball combined than soccer?
What is 10?
500
How are graphs used?
Answers will vary.