Rational/ Irrational
Linear or not
Function
Exponents
Graphs
100
A set of numbers is shown below/ A continuación se muestra un conjunto de números.
1/3, 1.13, sqrt5, 5/2
What number would need to be removed from the set so that the set contains only rational numbers?
¿Qué número habría que eliminar del conjunto para que este contenga únicamente números racionales?
sqrt5
100
Which of these do NOT represent a linear function?
¿Cuál de estos NO representa una función lineal?
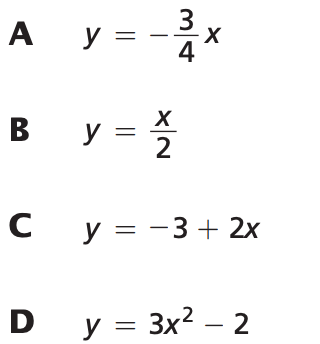
D
The x has an exponent of 2.
100
Which of these is NOT a function?
¿Cuál de estos no es una función?

Choice C
Vertical Line Test
100
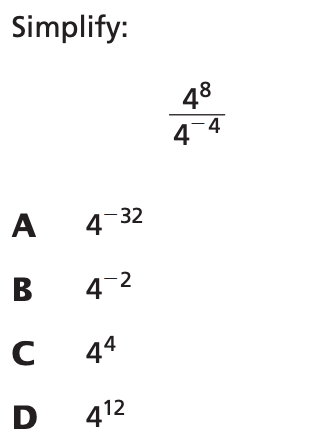
D
Quotient Rules: keep the base, subtract the exponents
8-(-4) = 12
100
Which line represents the best fit for the scatter plot?
¿Qué línea representa el mejor ajuste para el diagrama de dispersión?
The line is closest to the data.
La línea es la más cercana a los datos.
200
Rational or Irrational? Why?
¿Racional o irracional? ¿Por qué?
sqrt1.44
Rational, when put in the calculator it is a terminating (ending) decimal
Es racional; al introducirlo en la calculadora, resulta ser un decimal finito (que termina).
200
Which equation represents a linear function?
¿Qué ecuación representa una función lineal?

D
x is not a denominator, there is no exponent
x no es un denominador; no hay exponente.
200
Which table is NOT a function?
¿Qué tabla NO es una función?

Table T
There are repeated x values
Tabla T
Hay valores de x repetidos.
200
Which number is equivalent to
¿Qué número es equivalente a...?
3^4/3^2
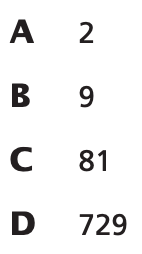
B
Quotient Rule
Subtract the exponents
4-2 = 2
200

What would the line of best fit reveal about these data?
¿Qué revelaría la recta de mejor ajuste sobre estos datos?
A There is a strong negative relationship between the cost of rent and the size of the office space.
Existe una fuerte relación negativa entre el costo del alquiler y el tamaño del espacio de oficina.
B There is a strong positive relationship between the cost of rent and the size of the office space.
Existe una fuerte relación positiva entre el costo del alquiler y el tamaño del espacio de oficina.
C There is a weak positive relationship between the cost of rent and the size of the office space.
Existe una relación positiva débil entre el costo del alquiler y el tamaño del espacio de oficina.
D There is a weak negative relationship between the cost of rent and the size of the office space.
Existe una relación negativa débil entre el costo del alquiler y el tamaño del espacio de oficina.
B There is a strong positive relationship between the cost of rent and the size of the office space.
Existe una fuerte relación positiva entre el costo del alquiler y el tamaño del espacio de oficina.
300
Which statement best describes the value of sqrt2 ?
¿Qué afirmación describe mejor el valor de sqrt2 ?
A between 0.5 and 1.0 / entre 0,5 y 1,0
B between 1.5 and 2.0 / entre 1,5 y 2,0
C between 1.0 and 1.5 but closer to 1.0 / entre 1,0 y 1,5, pero más cerca de 1,0
D between 1.0 and 1.5 but closer to 1.5 / entre 1,0 y 1,5, pero más cerca de 1,5
D
sqrt2 = 1.414213562
300
Which equation does not represent a linear function?
¿Qué ecuación no representa una función lineal?

D
The exponent is by the variable.
El exponente se encuentra junto a la variable.
In B the exponent is by the constant so it is still a function.
En B, el exponente se encuentra junto a la constante, por lo que sigue siendo una función.
300
Which graph represents a function?
¿Qué gráfico representa una función?

A : Vertical Line Test
A: Prueba de la recta vertical

300
Simplify:
Simplificar:
5^-8xx5^4
1/5^4
300
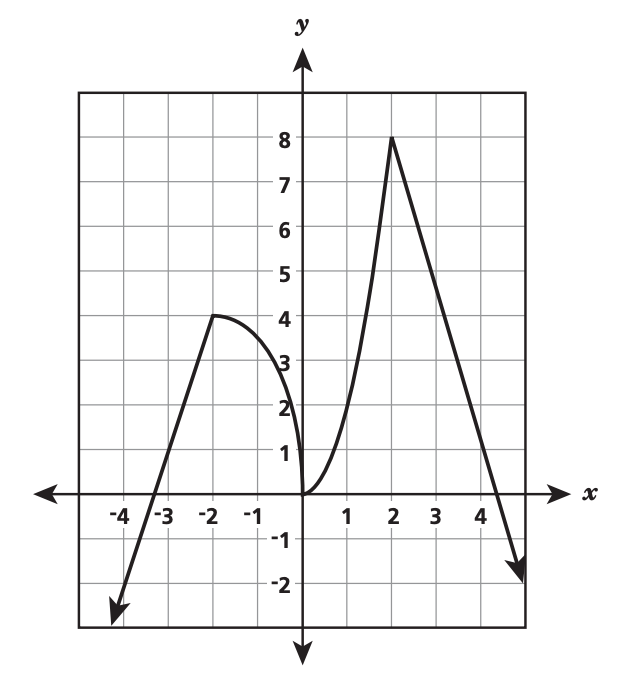 For which interval of x is the function decreasing and nonlinear?
¿Para qué intervalo de x es la función decreciente y no lineal?
between −4 and −2/ entre −4 y −2
between -2 and 0/ entre -2 y 0
between 0 and 2 / entre 0 y 2
between 2 and 4/ entre 2 y 4

between -2 and 0/ entre -2 y 0
400
Which statement about the value sqrt50 of is true?
¿Qué afirmación sobre el valor de sqrt50 es verdadera?
A It is irrational because the decimal equivalent eventually repeats. / Es irracional porque el equivalente decimal se repite periódicamente.
B It is rational because the decimal equivalent eventually terminates. / Es racional porque el equivalente decimal termina
C It is rational because the value as a decimal is equivalent to a fraction./ Es racional porque el valor como decimal es equivalente a una fracción.
D It is irrational because the decimal equivalent is non-repeating and does not terminate. / Es irracional porque el equivalente decimal no se repite y no termina.
D
sqrt50 = 7.071067812...
400
Which of these equations are linear?
¿Cuáles de estas ecuaciones son lineales?

Equation 1
Only one with no exponent by the variable
Solo uno sin exponente en la variable.
400
Which table is not a function?
¿Qué tabla no es una función?
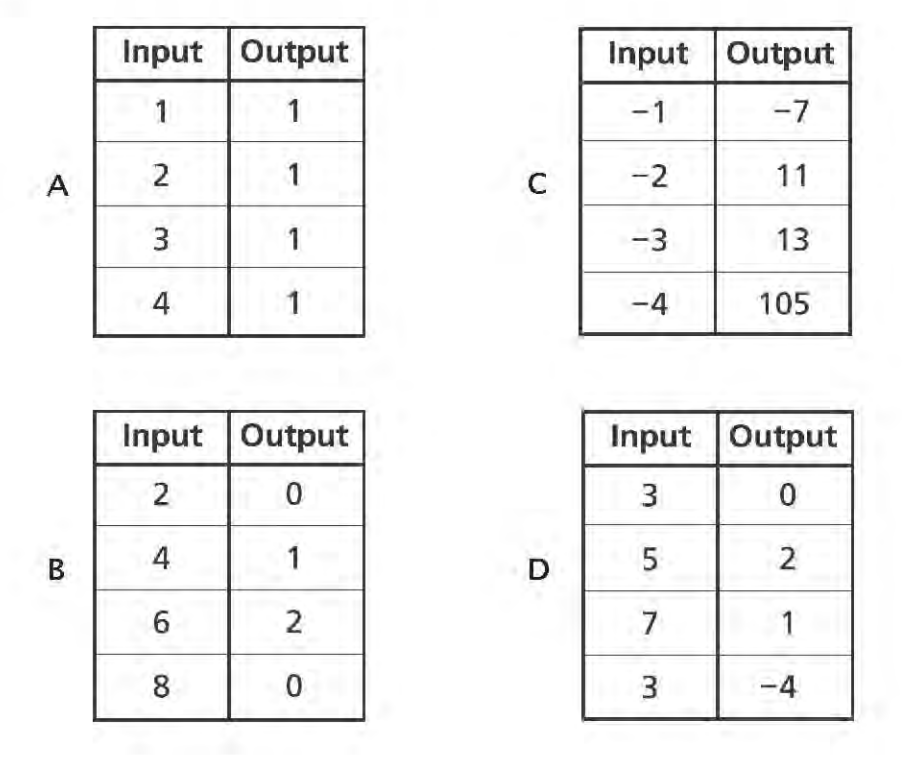
D
The 3 in the x column repeats.
El 3 en la columna x se repite.
400
Simplify
Simplificar
(5^-2)^5xx5^4
1/5^6
400
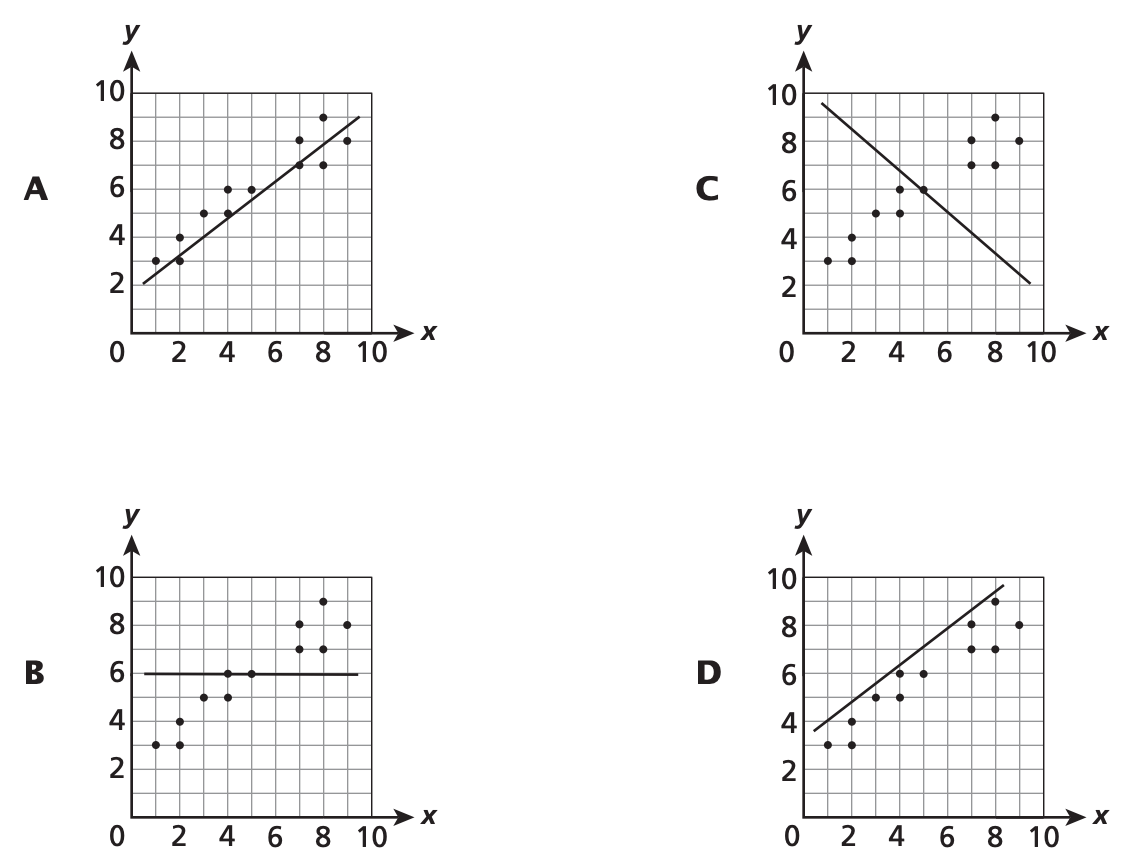
Line k is the line of best fit for a set of data on a scatter plot. The data show a strong linear association. Which scatter plot best represents these data and line k?
La recta k es la recta de mejor ajuste para un conjunto de datos en un diagrama de dispersión. Los datos muestran una fuerte asociación lineal. ¿Qué diagrama de dispersión representa mejor estos datos y la recta k?

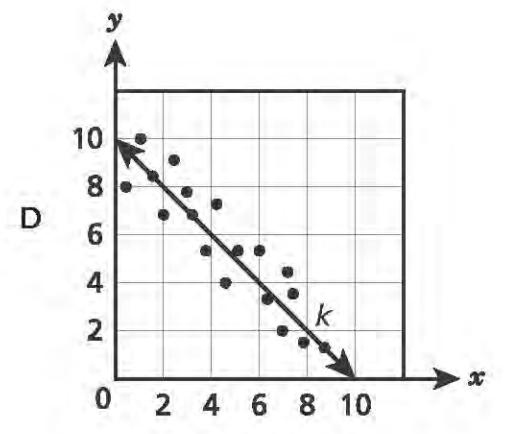
The data is closer to the line than in B
Los datos están más cerca de la línea que en B.
500
Which of these numbers are irrational?
¿Cuáles de estos números son irracionales?

sqrt32
500
Which equation is a non-linear function?
¿Qué ecuación es una función no lineal?
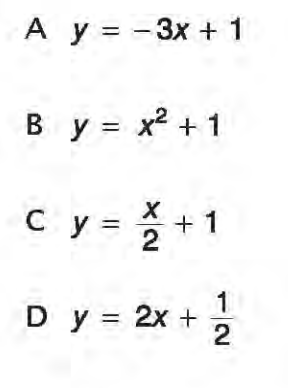
B
The variable has an exponent of 2
La variable tiene un exponente de 2.
500
 Which set of ordered pairs represents a function?
¿Qué conjunto de pares ordenados representa una función?
D
There are no repeating x values.
No hay valores de x repetidos.
500
Which expression is equivalent to
¿Qué expresión es equivalente a
(7^-8)(7^3)

C
Product Rule: Watch the negative sign
Regla del producto: Presta atención al signo negativo.
500
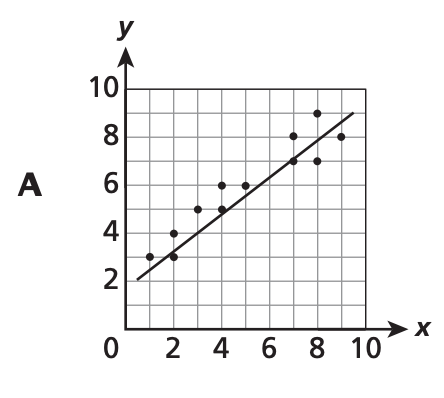
The shoe sizes and the heights for 20 classmates were plotted as ordered pairs on a scatter plot. A line of best fit was drawn to model the data. Which scatter plot shows the most accurate line of best fit?
Las tallas de calzado y las estaturas de 20 compañeros de clase se representaron como pares ordenados en un diagrama de dispersión. Se trazó una línea de mejor ajuste para modelar los datos. ¿Qué diagrama de dispersión muestra la línea de mejor ajuste más precisa?
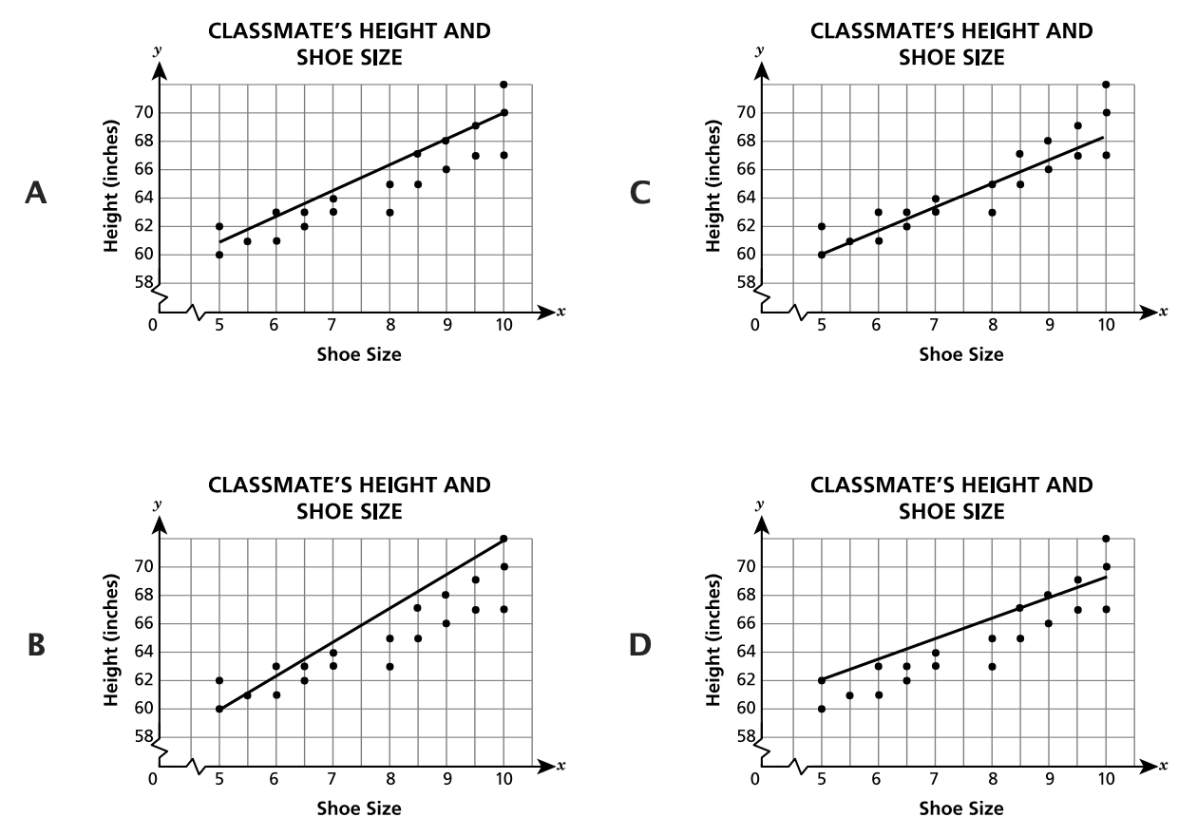
C
