Types of Data
Graphs/Displays
SOCS
z-Scores
Misc
Final Jeopardy
100
This type of variable places individuals into groups or categories (not numerical)
What is a categorical variable?
100
What are two different ways to represent one categorical variable graphically?
bar chart, pie chart, frequency table
100
The 4 main features of a distribution are...
What is shape, outliers/unsual points, center, and spread
100
In a particular data set, the mean is 25 minutes and the standard deviation is 5 minutes. What is the z-score of a value = 10 minutes? What are the units of the z-score?
-3 (z-scores do not have units)
100
What is a parameter?
A value associated with the population
200
This type of variable takes numerical values and measures quantities.
What is a quantitative variable?
200
What are two visualizations for one quantitative variable?
Histogram, dot plot, or stem plot
200
A distribution with a longer tail on the right is described as...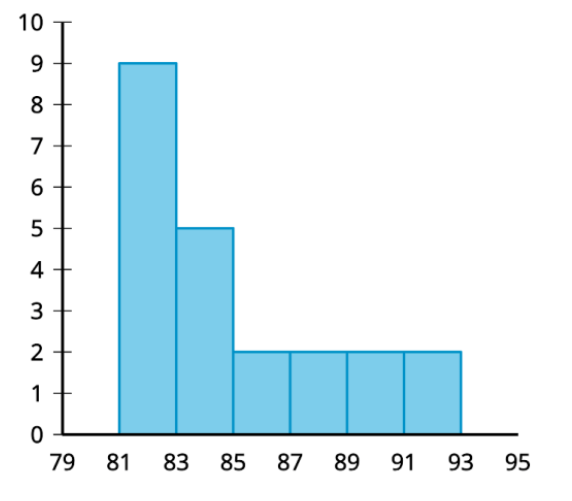
What is skewed right?
200
A local coffee shop records the amount of time customers wait for their orders. One customer's wait time has a z-score of -1.4. Interpret this value.
The customer's wait time was 1.4 standard deviations below the coffee shop's mean wait time.
200
What is the difference between a parameter and a statistic?
A statistic is a value associated with a sample; a parameter is a value associated with an entire population.
300
A survey asking students for their favorite sports team collects this type of data
what is categorical data?
300
What are the components of the five-number summary that is used to graph a box plot?
Minimum, Q1, Median, Q3, Maximum
300
Is the mean or median of this distribution higher? (no calculations necessary)
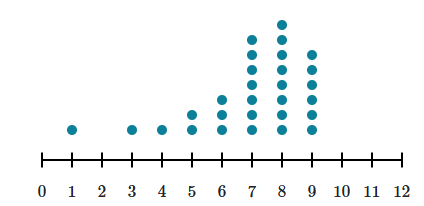
Since it is left skewed, the mean is pulled left, so the median is higher than the mean
300
The mean time to complete a puzzle is 40 seconds, with a standard deviation of 5 seconds. A student has a z-score of 2. It took this long for the student to solve the puzzle...
What is 50 seconds?
300
A school wants to estimate how many hours its 600 students spend on homework each week. The school randomly selects 75 students and asks them how many hours they spent on homework last week. These are the population and the sample (be as specific as possible).
Population: All 600 students at the school
Sample: The 75 students who were surveyed
400
Height measured in inches is an example of this kind of quantitative variable
what is continuous data?
400
How would I find the joint relative frequency of students in this class who are drivers and like watching TV/Movies?

Students who matched both divided by total students in study, so 3/18
400
Describe the distribution (you must use SOCS).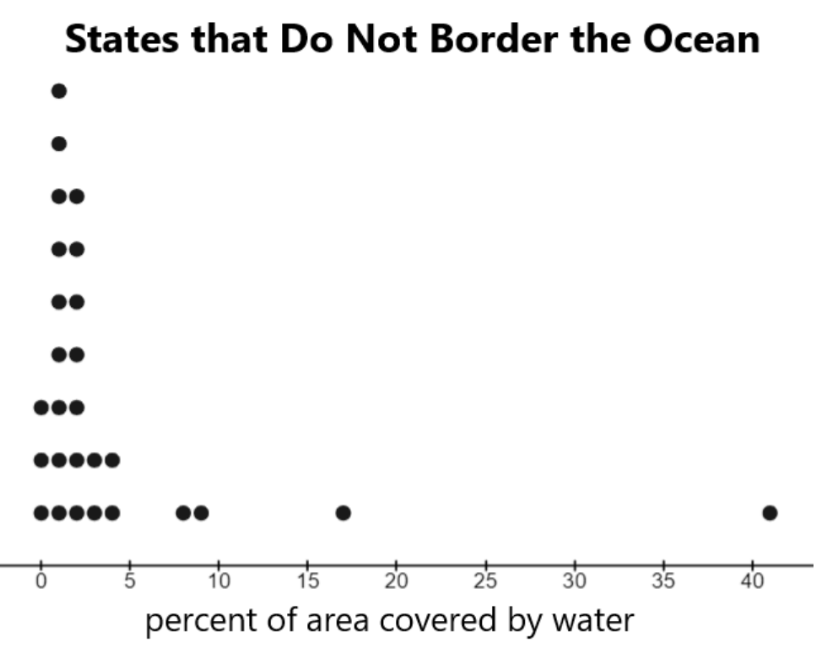
The median percentage of area covered by water within states that do not border an ocean is about 2.5%, there is an outlier which is over 40% covered by water, the distribution is skewed to the right, and the IQR is only about 3-5 whereas the range is above 40.
400
A particular data set has a mean of 25 and a standard deviation of 2. Assume a new data set is created by taking every value of the old data set, subtracting 25 from each value, and then dividing each value by 2. The mean and standard deviation of this new data set are
What are 0 and 1? (mean = 0, SD = 1)
400
These are the three measures of spread.
What are standard deviation, range, and IQR
500
The number of siblings a student has is this kind of quantitative variable
what is discrete data?
500
How do you determine if a data point is an outlier in a set of quantitative data? (There are 2 ways; I'll take either one)
1.5 x IQR above Q3 or below Q1
OR
2 Standard Deviations above or below the mean
500
Use SOCS to compare each distribution with context.
A school has a toy drive in which students bring in toys to be donated to charity. The number of toys donated by juniors and seniors is summarized in the histograms. Both distributions have a mean of 5 toys.
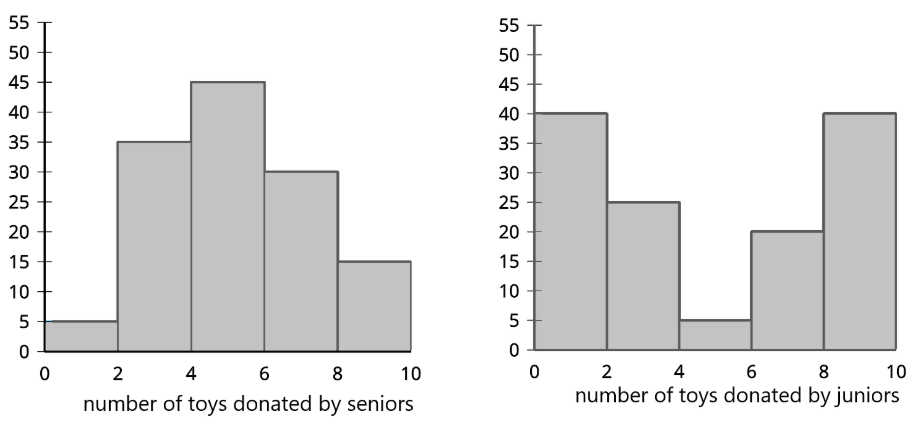
The seniors and juniors donated the same amount of toys on average, but the standard deviation of of the toys donated by the juniors was much higher. Both distributions were fairly symmetrical, but the toys donated by seniors is unimodal with a peak around 5 and the toys donated by juniors is bimodal with peaks at 0 and 10. There are no outliers in either distribution.
500
A data set has a mean of 50. A value of 38 has a z-score of -2. This is the standard deviation of this data set.
What is 6?
500
You cannot calculate this measure of center from a boxplot.
What is the mean?
500
The time customers spend in a grocery store is approximately normally distributed, with a mean of 40 minutes and a standard deviation of 6 minutes.
This is the percentage of customers who spend between 28 and 46 minutes in the store.
What is 81.5%? (68 + 27/2 using the Empirical Rule)