Scientific Method
Know Your Variables
Graph It!
Characteristics of Living Things
Science Challenge
100
Information gathered using your senses is called this.
What is an observation?
100
The variable deliberately changed by the scientist.
What is the independent variable?
100
The independent variable usually goes on this axis.
What is the x-axis?
100
All living organisms are made of one or more of these.
What are cells?
100
A student says, “Plants grow better with music.” What is missing that would make this a stronger scientific hypothesis?
What is a specific, measurable prediction?
200
A testable explanation or prediction for an observation.
What is a hypothesis?
200
The variable that is measured during an experiment.
What is the dependent variable?
200
The dependent variable usually goes on this axis.
What is the y-axis?
200
A sunflower turning toward sunlight demonstrates this characteristic of life.
What is responding to stimuli/the environment?
200
Two identical plants receive different amounts of water. Their height is measured after two weeks. What belongs on the y-axis of the graph?
What is plant height?
300
Scientists repeat trials mainly for this reason.
Improve accuracy and precision.
300
Factors kept the same between experimental groups.
What are constants?
300
This type of graph is usually best for showing how something changes over time.
What is a line graph?
300
Sweating when your body gets hot is an example of maintaining this.
What is homeostasis?
300
A researcher tests whether temperature affects cricket activity but also changes the amount of light in each trial. What is wrong with the experiment?
What is more than one variable is being changed?
400
A student notices plants near a window grow taller than plants across the room. Give one testable scientific question.
What is “How does the amount of light affect plant growth?”
400
Students test whether fertilizer affects plant height. They give plants 0 g, 5 g, or 10 g of fertilizer and measure their height after 3 weeks. Identify the independent variable.
What is the amount of fertilizer?
400
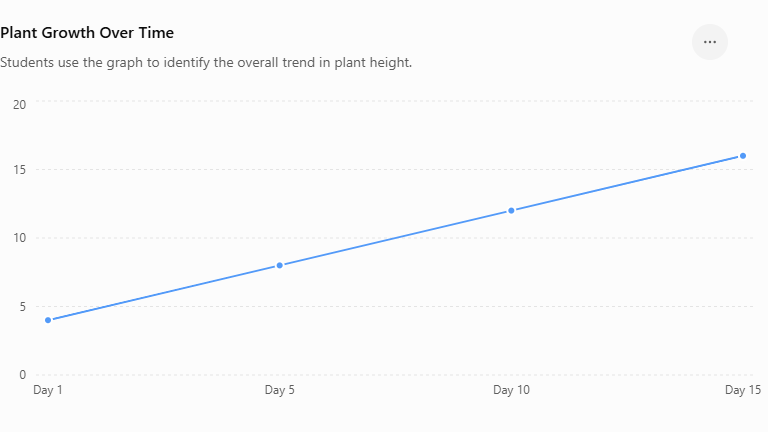
What is the trend in this graph?
What is plant height increases over time?
400
A tadpole becoming an adult frog demonstrates these two related characteristics of life.
What are growth and development?
400
A student conducts an experiment once and gets an unexpected result. What change would make the evidence more reliable?
What is repeat the experiment/use multiple trials?
500
After an experiment, the results do not support the hypothesis. What should the scientist do?
What is revise the hypothesis/use the evidence to develop a new explanation or experiment?
500
In the same experiment, students use identical plants, pots, soil, water, and light. Why are these variables kept constant?
What is to make sure fertilizer is the factor responsible for differences in plant growth?
500
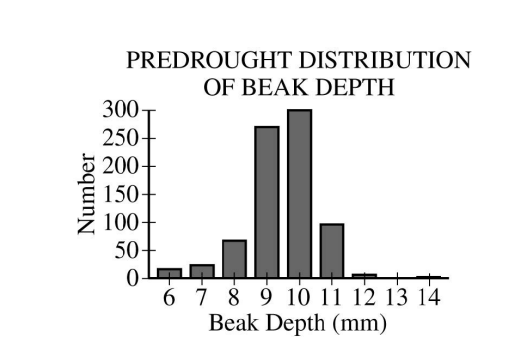
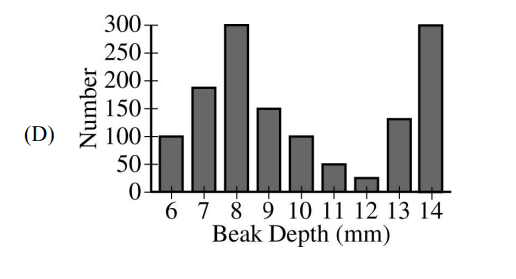
How did the beak size of birds change before and after a significant drought?
Decrease in beak size of 9-10mm and increase increase in beak size of 8 and 14mm.
500
Bacteria become resistant to antibiotics over many generations. This demonstrates what characteristic of living things?
What is populations evolve over time?
500
A seed uses stored nutrients, grows roots, responds to gravity, and eventually produces a mature plant. Name three characteristics of life demonstrated.
What are using energy/metabolism, growth and development, and response to stimuli?