1.1
1.2
1.3
1.4
1.5
100
The science and art of collecting, analyzing, and drawing conclusions from data
Statistics
100
Shows each category as a bar. The heights of the bars show the category frequencies or relative frequencies
Bar Chart
100
Shows each data value as a dot above its location on a number line
Dotplot
100
Stem and leaf plot
100
Shows each interval as a bar. The heights of the bars show frequencies or relative frequencies of values in each interval.
Histogram
200
A person, animal, or thing described in a data set
Individual
200
The number of times a specific value, number, or event occurs in a dataset
Frequency
200
A distribution where the right side of the graph is an approximate mirror image of the left
Roughly Symmetric
200
Consists of all but the final digits in a stem and leaf plot
Stem
200
Describe the shape of the distribution.
Skewed to the right
300
Any attribute that can take different values for different individuals
Variable
300
Shows each category as a "slice" of the pie. The areas of the slices are proportional to the category relative frequencies
Pie Chart
300
A distribution where the left side of the graph is much longer than the right side
Skewed to the Left
300
Explains in context what the stems and leaves represent
Key
300
Describe the Variability.
2-9
400
Takes values that are labels, which place each individual into a particular group, called a category
Categorical Variable
400
the ratio or fraction of times a specific value or event occurs compared to the total number of observations or trials in a dataset
Relative Freqeuncy
400
A value that falls outside the overall pattern
Outlier
400
Represents the final digit of each data value
Leaf
400
In which interval is the center?
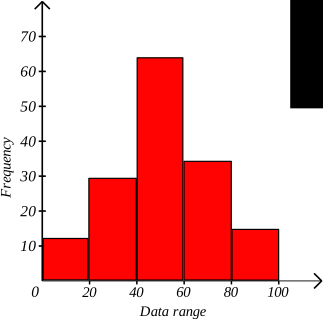
40-60
500
The _____ of a variable tells us what values the variable takes and how often it takes these values
Distribution
500
Which of the following is a categorical variable?
Height, Eye Color, Temperature
Eye Color
500
The range of values in a distribution
Variability
500
Takes number values that are quantities, counts, or measurments
Quantitative Variable
500
Who/what is my individual in the following histogram?
Black Cherry Trees