6.SP.1 - Statistical or Non-Statistical
6.SP.2 - Understanding Data Collected
6.SP.3 - Measure of Center
6.SP.4 - Dot Plots, Histograms, Box Plots
6.SP.5 (part a, b, c, & d)
100
DJ:
What is the difference between a statistical and non-statistical question?
Statistical questions have a variety of answers, non-statistical questions have only one correct answer.
100
What is the shape of this data?
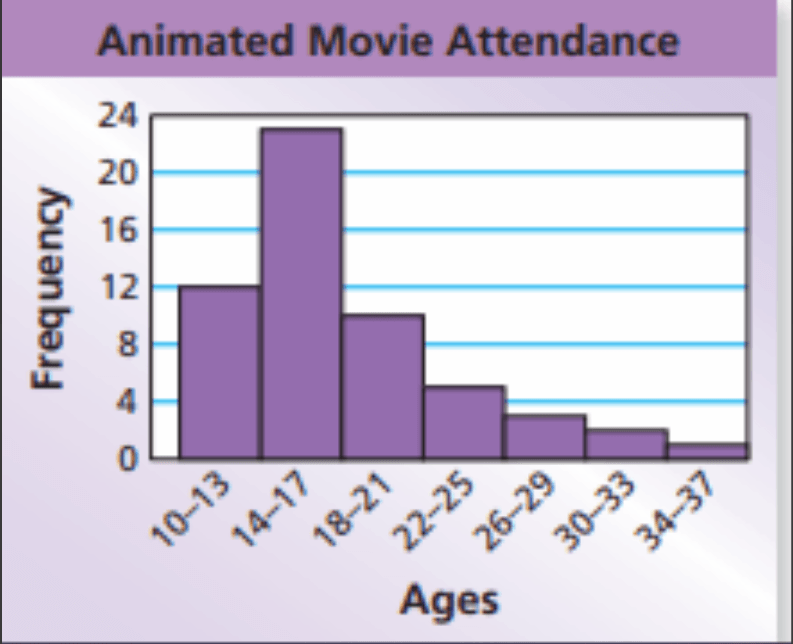
Skewed to the right.
100
How can you find the mean of a data set?
You would add up all the data values and divide the sum by the number of data points.
100
What type of data display is this? Dot plot, box plot, histogram, etc.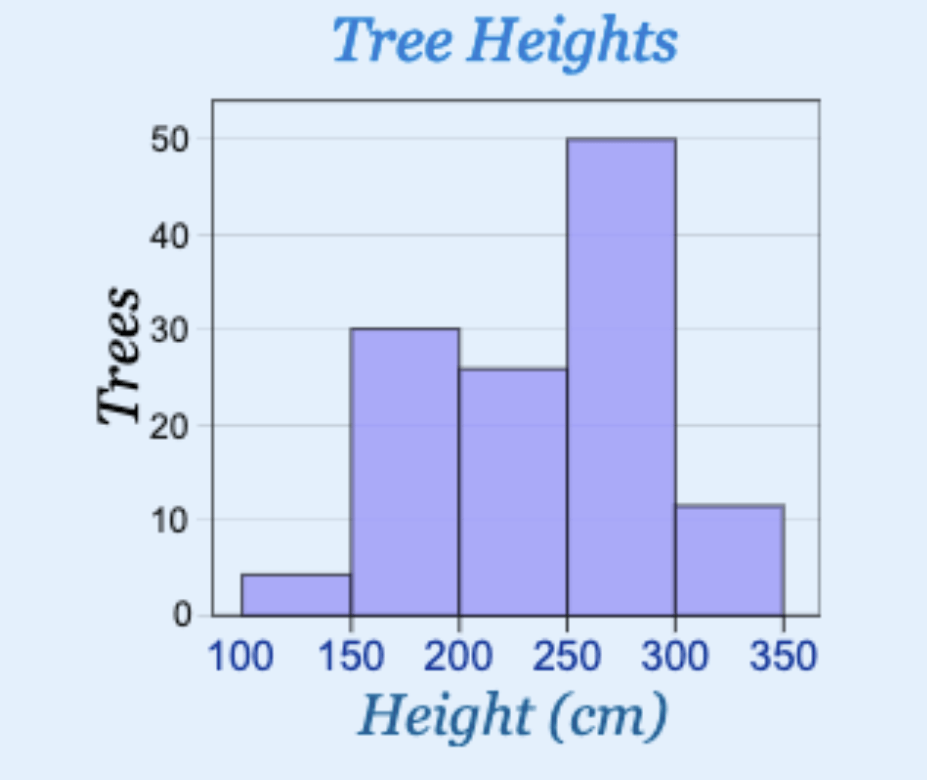
Histogram
100
How many classmates have visited MORE THAN 15 states?
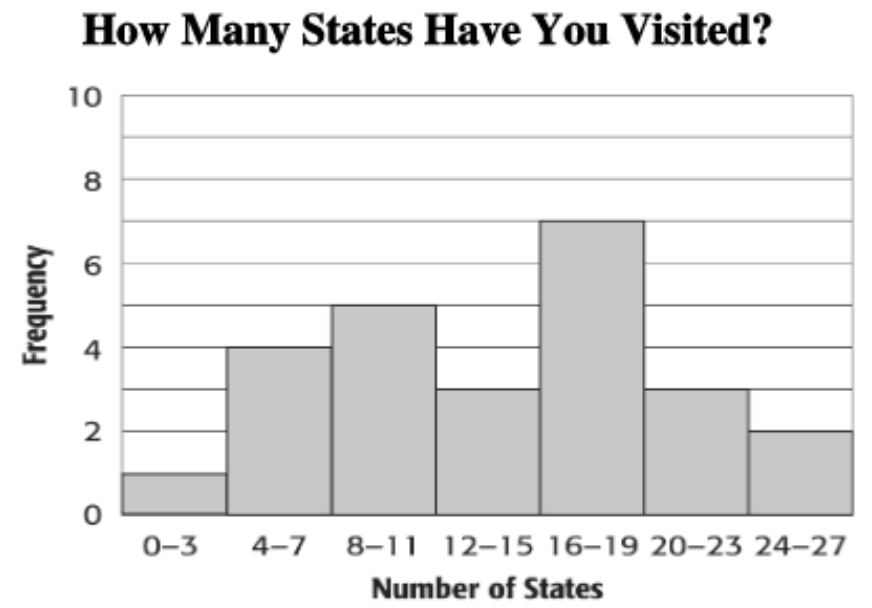
12
200
Is this a statistical question: How many minutes do 6th grade students typically spend on homework nightly?
Statistical
200
What is the mode?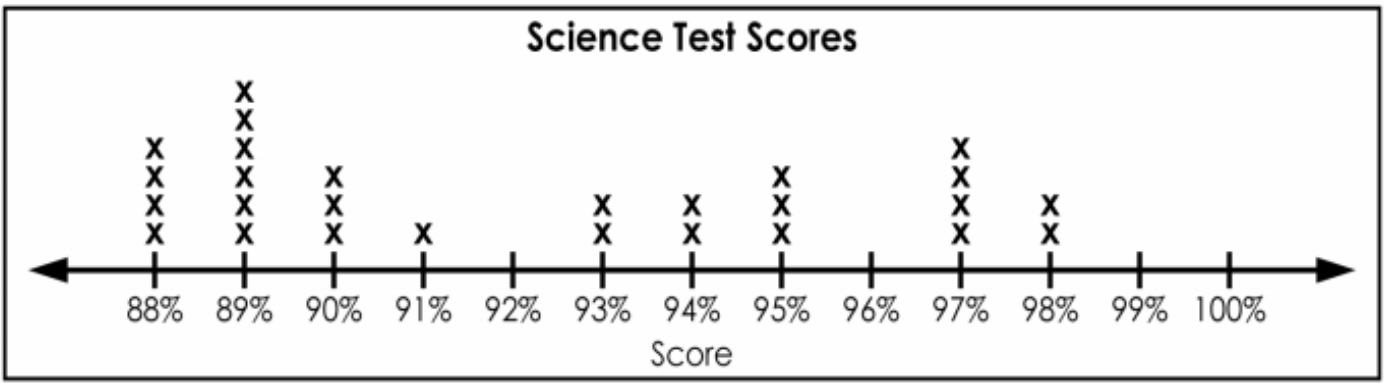
89%.
200
DJ:
Find the mean of these numbers:
2, 57, 38, 42, 6
29 is the mean
200
DJ:
How many observations were collected in this frequency table?
20
200
What is the IQR?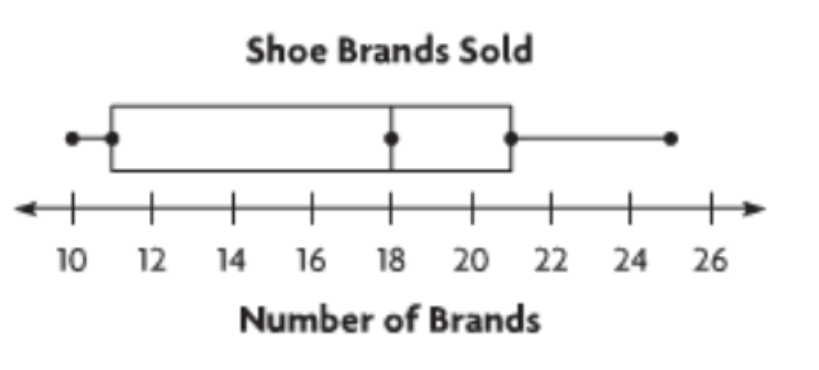
10 because 21 - 11 is 10.
300
Is this a statistical question: How many music videos has Cardi B made?
No, it's non-statistical.
300
What is the range?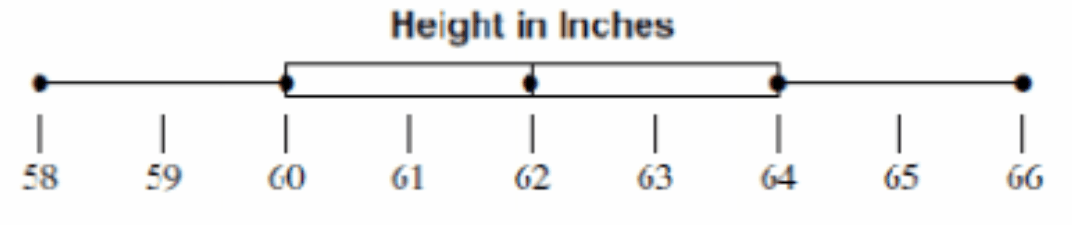
The range is 8 because 66-58 = 8.
300
To find the ________ you put all numbers in order from least to greatest and find the number that is in the middle.
median
300
Using this box plot, what data value is the upper quartile (Q3)?
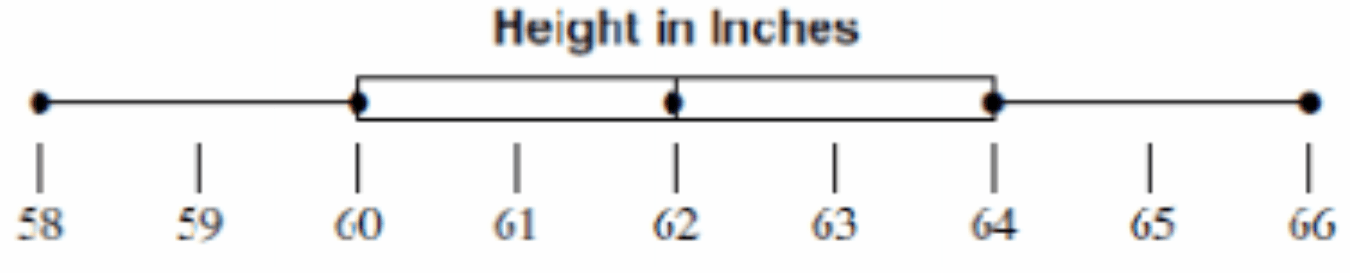
64
300
DJ:
Looking at the box plot, what is the IQR?
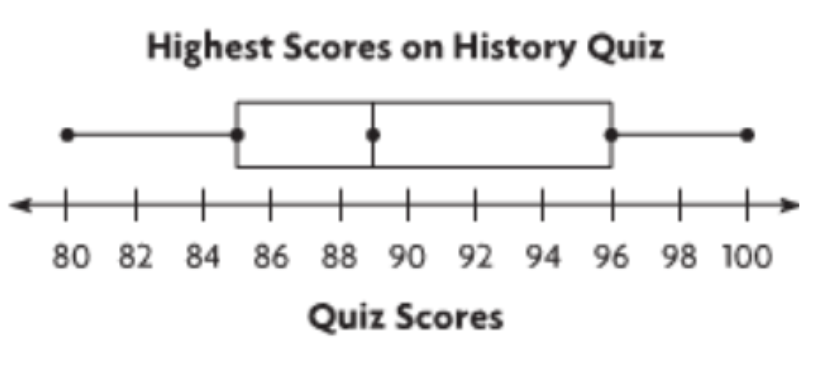
11 because 96 - 85 is 11.
400
Is this a statistical question: What time does school get out today?
No, its a non-statistical question.
400
What is the peak AND the shape of the data.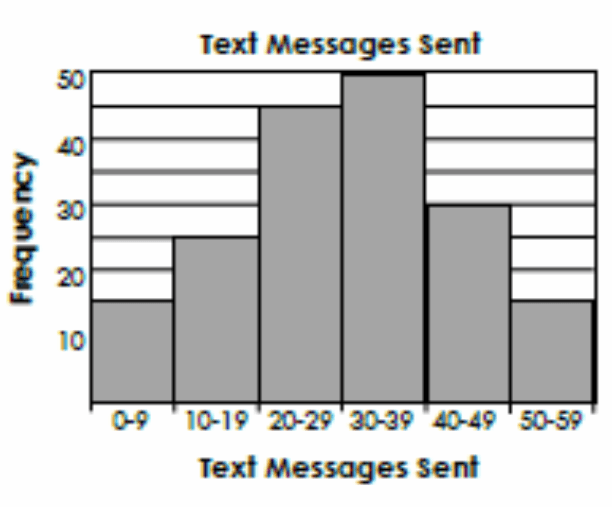
The peak of the data occurs within the category "30-39" text messages, and the shape of the data is symmetrical.
400
To find the ______ you put all numbers in order from least to greatest and then take the largest number minus the smallest number.
Range
400
______ is a set of information collected about people or things.
Data
400
What is the value of the missing number in the list of data set below, if the MEAN "Average" is 14.
5, x, 21, 21, 7, 13
The missing number is 17.
500
Statistical or non statistical?
How many siblings do the students in our class have?
Statistical
500
The data set below has an outlier. What is the outlier, and explain how you know?
12, 15, 59, 11, 16, 18, 12, 12
59 because the other values are all in the tens and 59's value is in the fifties.
500
Find the Mean and the Median of:
8, 14, 32, 6, 15
The mean is 15.
The median is 14.
500
How many students are between 60 and 63 inches tall?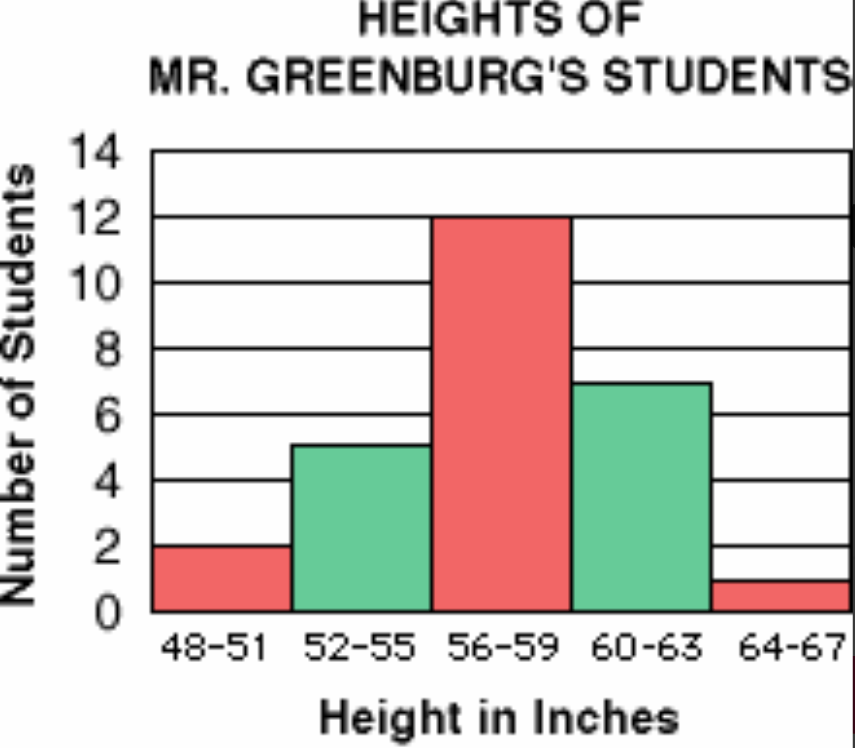
7 students
500
Find the Mean Absolute Deviation for the following Data set: 19, 32, 24
Round your MAD to the nearest tenth.
The MAD is 4.7