Show Me the Data!
Center of Attention
“Stats Got Jokes!” 😂
“Spread the Word!”
“Put a SOCS in It!” 🧦
100
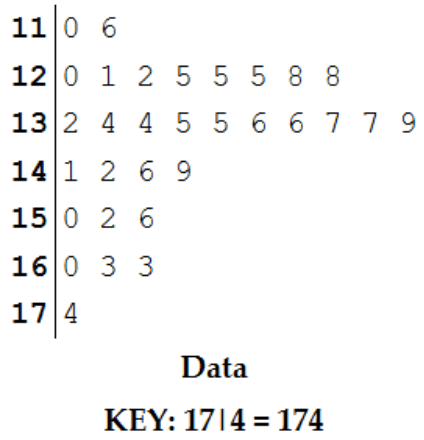
Given the stemplot below, which is the best description of the data?
(A) Skewed distribution, mean greater than median
(B) Skewed distribution, median greater than mean
(C) Symmetric distribution, mean greater than median
(D) Symmetric distribution, median greater than mean
What is A?
100
A basketball player scores 14, 22, 17, 25, and 12 points in five games. This is the player’s mean score.
What is 18 points?
100
Add everybody up, then divide by the number of people. Apparently, even numbers have to split the dinner bill.
What is the mean?
100
A basketball team scores 58, 72, 65, 91, and 77 points in five games. This is the range of its scores.
What is 33 points?
100
Forget the socks disappearing in your dryer. In statistics, SOCS stands for these four things we describe in a quantitative distribution.
What are Shape, Outliers, Center, and Spread?
200
The bar graph shows the distribution of how many books a group of students read over the summer. How many students were surveyed?
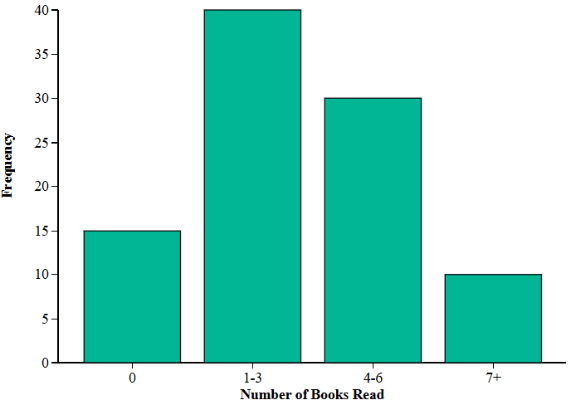
What is 95 students surveyed?
200
Eight students report daily screen times of 7, 3, 5, 2, 8, 4, 6, and 3 hours. This is the median screen time.
What is 4.5 hours?
200
I’m the biggest value minus the smallest value—basically, the distance between “I studied all weekend” and “We had a test?”
What is the range?
200
Eight students report reading 2, 4, 6, 8, 12, 10, 14, and 16 books. Using the median of each half for the quartiles, this is the five-number summary.
What are 2, 5, 9, 13, and 16?
200
Symmetric? Skewed? One peak or two? I describe a distribution’s appearance without roasting its outfit.
What is shape?
300
The graph shows the number of pushups a Statistics class can do in one minute. What is the IQR of this data set?
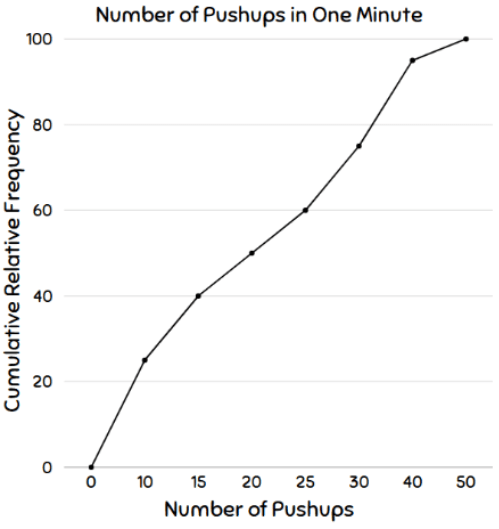
What is 20?
300
When your chosen measure of spread is standard deviation, this should be your chosen measure of center.
What is mean?
300
Everyone else’s commute is 10–20 minutes. Yours is three hours because you “know a shortcut.” Your commute might be one of these unusual values.
What is an outlier?
300
The first quartile of students’ commute times is 12 minutes, and the third quartile is 28 minutes. Give the IQR and the percentage of data represented by the box in a boxplot.
What are 16 minutes and approximately 50%?
300
Most students never bring their own pencil to class. You brought 47 pencils with you. These unusual values make us say, “Were you planning to supply the entire school?”
What are outliers?
400
Given the boxplot, which of the statements are true?
I. It is a left skewed distribution which has outliers.
II. It is a symmetrical distribution which has outliers.
III. The interquartile range is less than 1.
IV. Approximately 75% of the observations are less than 3.5.
IV. The range is 4.
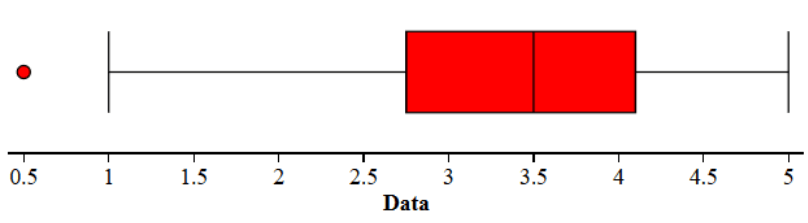
What is I.?
400
Five friends have a mean age of 24 years. Their 32-year-old friend leaves. This is the mean age of the remaining four friends.
What is 22 years?
24*5=120
120-32=88
88/4=22
400
I group numerical data into intervals, and my neighboring bars touch. We’ve discussed personal space. They’re not interested.
What is a histogram?
400
A data set has Q1 = 20 and Q3 = 32. Using the 1.5 × IQR rule, determine whether a value of 51 is an outlier and justify your answer.
What is yes, because 51 exceeds the upper fence of 50?
400
The mean and median both describe me. I tell you where the data’s middle is—because “somewhere over there” won’t earn full credit.
What is center?
500
What is the range of the data displayed in the dotplot?

What is 8?
Max:5 Min: -3 Range = Max - Min
Range = 5-(-3) → 5 + 3 = 8
500
A player averages 18 points across four games. To raise that average to 20 points across five games, the player must score this many points in game five.
What is 28 points?
18*4=72
20*5=100
100-72=28
500
I measure how spread out values are around the mean. When I’m large, the numbers are scattered like students the second the dismissal bell rings.
What is standard deviation?
500
Of 80 students, 68 scored below Jordan’s score. Using the percentage of scores strictly below Jordan’s, identify Jordan’s percentile and explain its meaning.
What is the 85th percentile, meaning 85% of students scored below Jordan?
500
Range, IQR, and standard deviation measure me. I tell you whether the data stays close together or needs a group chat to find everybody.
What is spread?