Reading
Graphs
Measure of Central Tendency and Dispersion
Types of Graphs
Drawing Conclusions from Samples
Experimental and Observational Studies
100

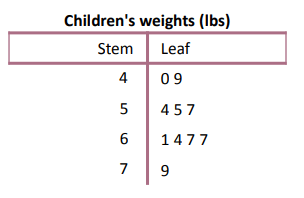
How many children did they find the weight of?

What is 10 Children?

100
The mean, median, and mode of this data set. 6, 22, 4, 15, 10, 8, 8, 7, 14, 20
What is... Mean - 11.4 Median - 9 Mode - 8 ?
100

This type of graph has a lot of low values (skew right or skew left)

What is skew right.
100
What is the difference between and unbiased and biased sample?
An unbiased sample represents the population you want information about, and a biased sample overrepresents the population or underrepresents part of the population.
100
In this kind of study, an investigator assigns the individuals to the experimental group or the control group.
What is an experimental study?
200

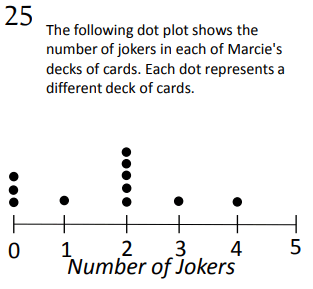
How many more decks had 2 jokers than 1 joker?

What is 4 Decks?

200
The range and standard deviation of this data set 47, 18, 65, 28, 43, 18
What is... Range - 47 Standard Deviation - 18.56 ?
200

This graph has a lot of high values (skew right or skew left?)

What is skew left?
200
Amy, a reporter, wants to survey workers about where they eat lunch during a typical work week. She writes a column asking workers to call a special phone number and identify where they eat lunch during a typical work week. This is an example of what type of sampling method?
What is self-selected. The workers can choose whether or not to respond.
200
In this kind of study, the assignments of individuals to the experimental group or the control group is our of the investigator's control.
What is an observational study?
300

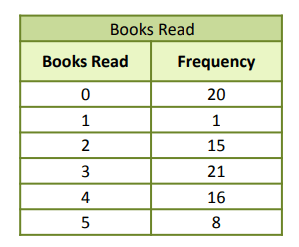
How many more people read 3 books than 5 books?

What is 13 more people?

300
The mean, median, and mode of this data. 0.12, 0.54, 0.36, 0.17, 0.36, 0.94, 0.88
What is.... Mean - about 0.48 Median - 0.36 Mode - 0.36 ?
300

A type of graph used to plot the range of heights of people in a group.

What is a histogram.

300

A real estate agent wants to know if first-time home buyers used the Internet to research home listings. The real-estate agent calls every fifth first-time home buyer and asks them if they used the Internet to research home listings. What type of sample is described?

A Systematic Sample
300
you want to study the effect that music has on the ability to recall knowledge. Each individual in your study is given a piece of unfamiliar reading material and then asked to take a factual quiz on the reading material. The control group is individuals who read the material and take the quiz in a quiet room. the experimental group is individuals who read the material and take the quiz in a room that has classical music playing. Tell whether this study is experimental or observational.
This is an experimental study because you assign individuals to groups.
400

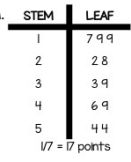
What is the difference between the largest number and the smallest number?

What is 37?

400
The range and standard deviation of this data set. 29.4, 22.9, 15.7, 26.9, 24.0, 27.5, 11.4
What is... Range - 18 Standard Deviation - 6.1 ?
400

A word that describes how spread out the data in a graph is (Range, IQR, Standard Deviation)

What is variability

400

If we wanted to know about students at HRHS, and we only spoke to ten students, the ten students represent a...

What is a sample
400
A manager wants to study the effects that positive reinforcement has on an employee's willingness to work overtime. The control group is employees who are given no reinforcement. The experimental group is employees who are given positive reinforcement during their weekly meeting with their manager. Is this study experimental or observational? Explain.
Experimental study; the manager is assigning employees to the control group and the experimental group.
500

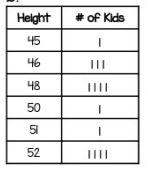
How many kids had a height that was taller than 48 inches but shorter than 52 inches?

What is 2 Kids?

500
The mean, median, mode, range, and standard deviation of this data set. 51, 48, 47, 46, 45, 43, 41, 40, 40, 39
What is... Mean - 44 Median - 44 Mode - 40 Range - 12 Standard Deviation - 3.8 ?
500

A plot that shows the five number summary AND has an "Interquartile range"

What is a box-and-whisker plot.

500

The whole group of people we are interested in...

What is a population

500
A professor wants to study the effects that teaching outdoors has on his test scores. Each individual in the study is given the same lectures for a month, and tested indoors. The control group is individuals who were lectured and tested outdoors. Tell whether the study was experimental or observational.
The study was experimental; the professor is assigning individuals to the control group and the experimental group.
M
e
n
u