Mean/MAD
Median/IQR/Boxplot
Vocab
100
Some students got these scores on a quiz:
80, 95, 85, 80, 100, 70
What was the mean quiz score?
85 points
100
Find the 5-number summary for the following dataset.
5, 2, 9, 8, 8, 3, 6
Minimum: 2
Q1: 3
Q2/Median: 6
Q3: 8
Maximum: 9
100
Write a question that is collecting categorical data and a question that is collecting numerical data. Clearly label which is which.
Answers Vary.
200
The ages of 7 students at the library are listed below:
5, 5, 10, 10, 12, 14, 14
What is the mean and the MAD?
Mean = 10
MAD = 2.9
200
Find the range and the IQR of the following dataset:
6, 9, 2, 12, 20, 6, 7, 8, 4, 15
Range = 18
IQR = 6
200
What are two measures of center?
Mean and Median
300
The mean is a measure of _____________.
The MAD is a measure of _____________ .
The mean is a measure of center.
The MAD is a measure of spread .
300
Draw a boxplot of the following data.
6, 9, 2, 12, 11, 6, 7, 8, 4, 12

300
What does IQR stand for? What does is measure?
Write at least 3 complete sentences.
Answers Vary.
IQR stands for interquartile range. It is a measure of spread/variability. It measures the distance between Q1 and Q3. It shows us how close together the middle 50% of the data is.
400
Draw two dotplots.
Both dotplots should have approximately the same MAD.
Dotplot A should have a significantly smaller mean than Dotplot B.
Answers Vary
400
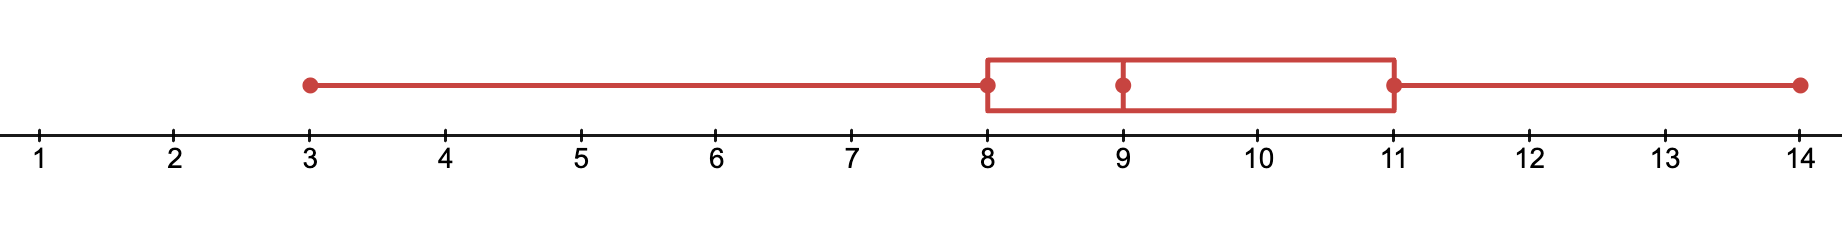 What is the range of this dataset?
What is the IQR of this dataset?
Range: 11
IQR: 3
400
What is the difference between mean and median?
The mean is the average. To find it, we add all the data together and divide it by the number of values.
The median is the middle. To find it, we put all of the data in order and find the middle number.
500
Draw two dotplots.
Both dotplots should have approximately the same mean.
Dotplot A should have a significantly bigger MAD than Dotplot B.
Answers Vary
500
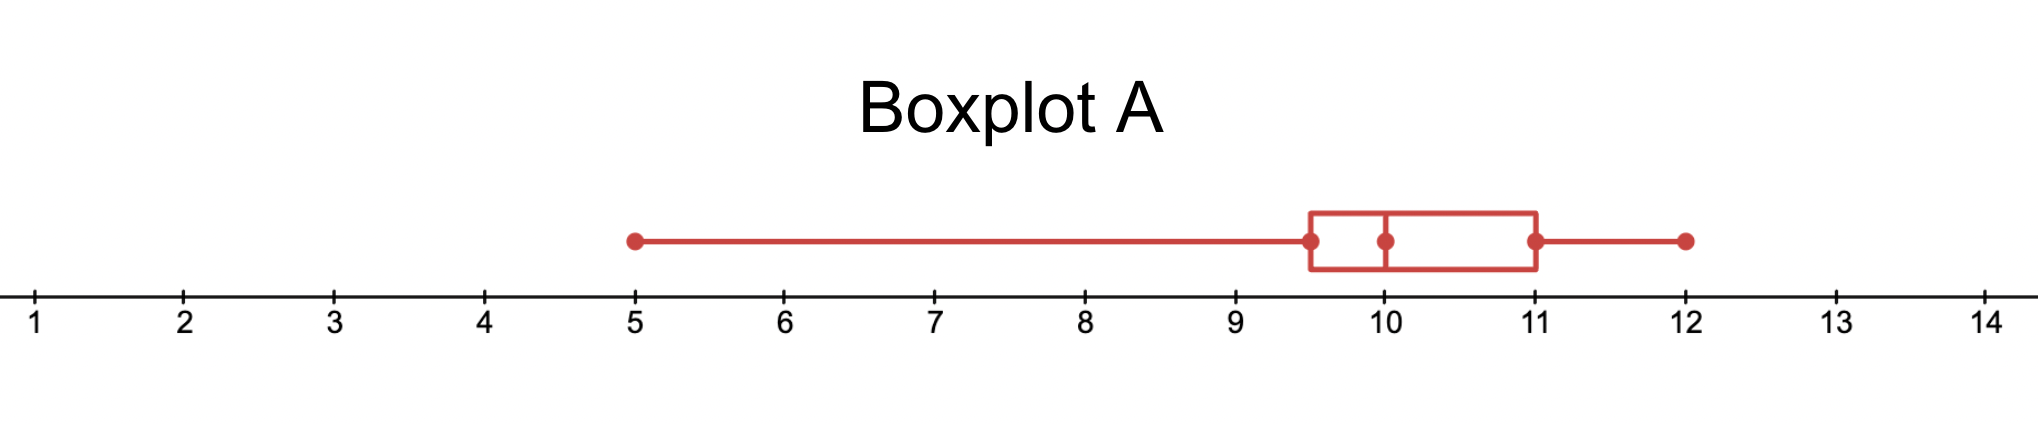

Which boxplot has greater variability? Explain.
Boxplot B: the range and the IQR are greater than in Boxplot A.
500
What are 3 measures of spread/variability?
Range, IQR, MAD