Compare Different Graphs
Circle Graphs
Mean
Median
Mode
100
100 people were surveyed about their favorite pizza toppings. If you wanted to make a bar graph of this data, what would sausage go to?
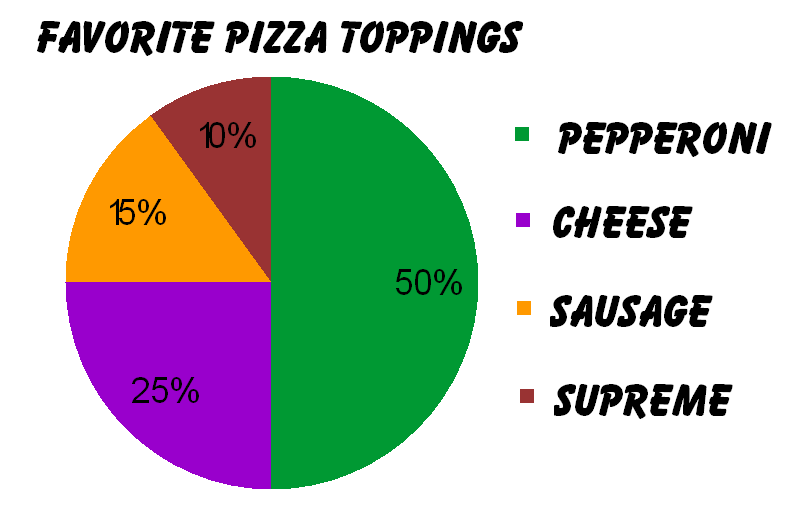
15 people
100
30 people were surveyed about their favorite pizza toppings. How many people chose pepperoni?
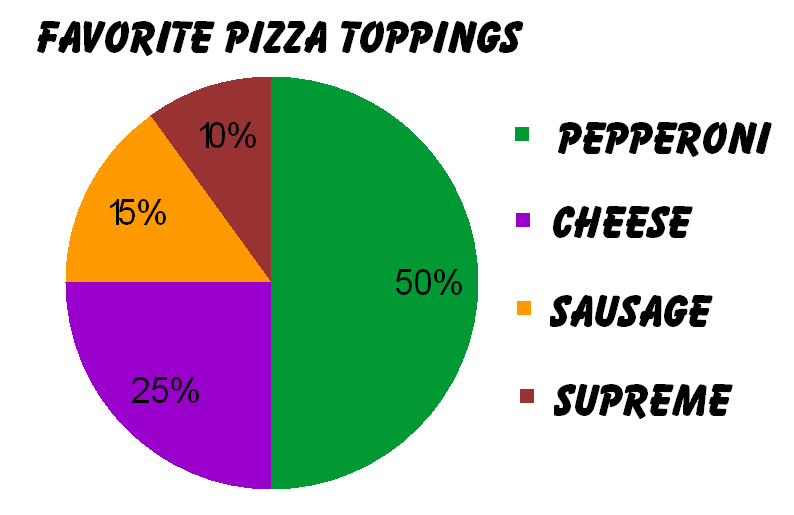
15 people
100
What is the balance point of the following data set?
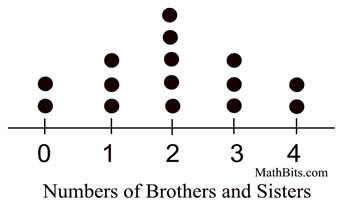
2
100
Find the median of this data set:
13, 15, 17, 18, 20, 20, 20, 21
19
100
Find the mode of this data set:
13, 15, 17, 18, 20, 20, 20, 21
20
200
If you wanted to make a circle graph with this data, what percentage would dogs be?
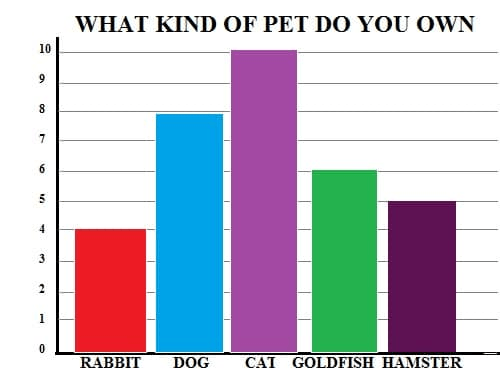
About 24%
200
30 people were surveyed about their favorite pizza toppings. How many people chose supreme?
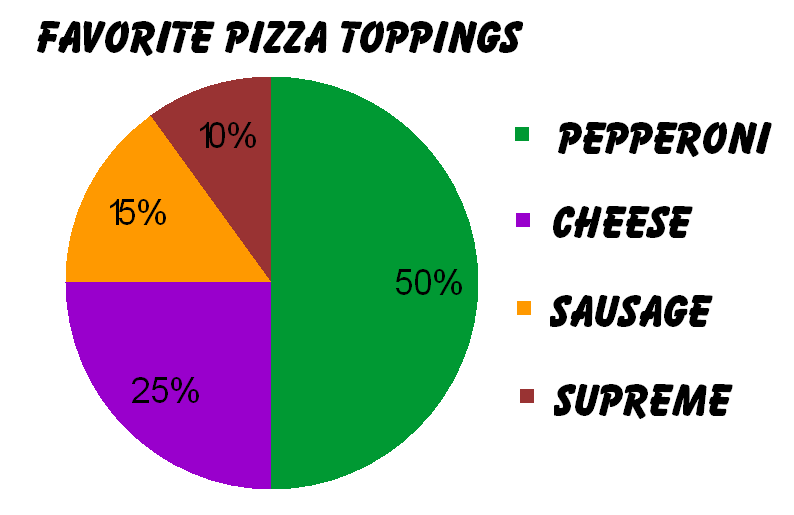
3 people
200
Find the balance point for the following data set.
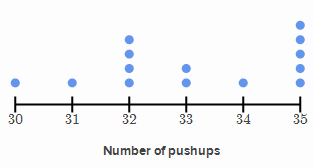
33
200
Find the median of this data set.
81, 73, 92, 75, 72, 79, 90
79
200
Find the mode of this data set.
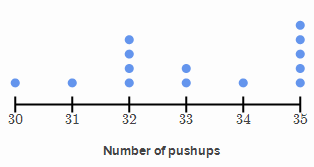
35
300
If you wanted to make a circle graph for this data, what percentage would 1990 be?
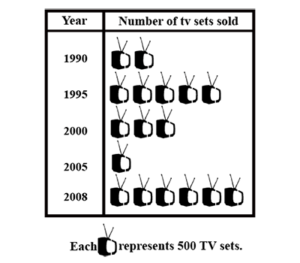
About 12%
300
400 people were surveyed about their favorite pizza toppings. How many people chose cheese?
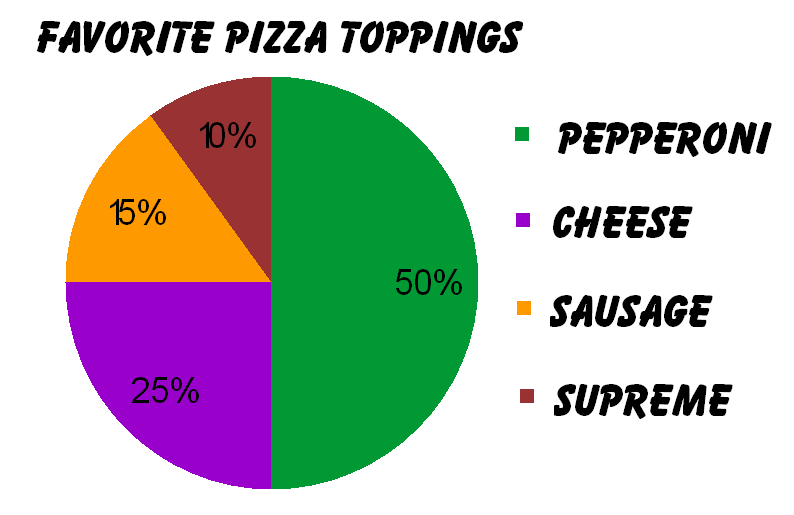
100 people
300
Find the mean of this data set:
13, 15, 17, 18, 20, 20, 20, 21
18
300
Find the median number of apples sold.
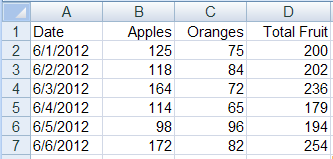
121.5
300
Find the mode of this data set.
12, 21, 14, 18, 10, 28, 14, 18, 12, 35, 14
14
400
50 people were surveyed about their favorite ice cream flavors. What is the difference between the amount of people who chose mango and the amount of people who chose strawberry?
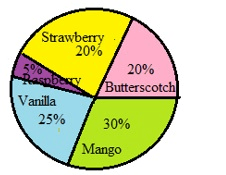
5
400
Original Data: 22, 22, 23, 28, 32, 36
Will the mean increase, decrease or stay the same if we add a 24 to our data?
Decrease
400
The following are test scores from a math class.
53, 53, 63, 41, 75, 75, 75, 66, 80
What happens to the median if a new students scores a 64? (increase, decrease, stay the same)
Decreases
400
A student surveys his class on the number of pets they have: 0, 2, 2, 1, 5, 3, 0, 2, 1, 0, 2, 2, 3, 3
The teacher wanted to be included in the data and she has 2 pets. What happens to the mode? (increase, decrease, stay the same)
Stay the same