Bar Graph
Pictograph
Line Graph
Mixed Bag
Tally Chart
100

How many students favorite sport is basketball?
What is 6 students?
100

How many people say their favorite fruit is an apple?
What is 10 people?
100
Line Graphs use lines and points to show Data.
True or False
True
100

How many children were at after school care on Tuesday?
What is 5?
100
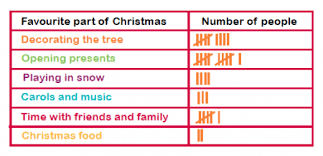
How many people liked "time with friends and family?"
What is 6?
200

How many people own both a rabbit and cat?
What is 15 people?
200

How many apples were sold in February?
What is 40 apples?
200
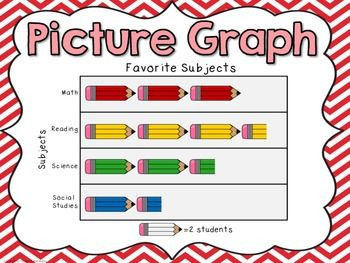
What is the least favorite subject?
What is social studies?
200

17
300
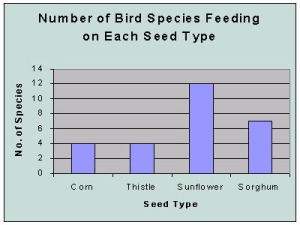
How many Sorghum?
What is 7?
300
How many people liked the color green?
What is 11?
300

How many people like tennis and basketball combined?
What is 12?
300

What happens when you get to 5?
Draw a line striking through.
400

How many 4th graders?
What is 55 students?
400
What month has 30?
March
400

How many students like softball ?
What is 4?
400

What is the most popular? most votes.
Opening Presents
500

What do you see on the Y axis?
Number of people
500
How many students liked hockey and baseball combined?
What is 70?
500
This situation is when you would use a line graph.
To show change over time.
500
The key says each pencil is worth ____.
What is 2?
500
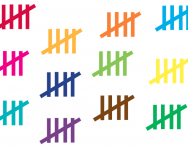
What is the total of these tallies?
What is 60?