Graphs
Vocab
Mean...
Bias/Sampling
Comparing Populations
100
A type of graph used to represent parts of a whole in percentages.
What is a pie chart or circle graph?
100
A part of the whole population
What is SAMPLE?
100
The average of the data.
What is the mean?
100
A point of view based on a predetermined idea or prejudice, without any scientific evidence.
What is bias?
100
Who has older members of the population?

Who is the United States?
200
A type of graph used to compare data and has bars.
What is a bar graph?
200
The whole group
What is POPULATION?
200
The number that appears most often in a series of numbers.
What is the mode?
200
Each member of the population has an equal chance of being selected.
What is Random Sampling?
200
Who has lower population density?

Who is Russia?
300
A type of graph that shows changes over time and or how one variable changes in relationship to another.
What is a line graph?
300
You pick sample members based on a system
What is Systematic Sampling?
300
The middle number in a series of numbers.
What is the median?
300
In an experiment, the same results are obtained each time that the same procedures are followed.
What is reproducible?
300
By 2050, who will be the largest age group in China?
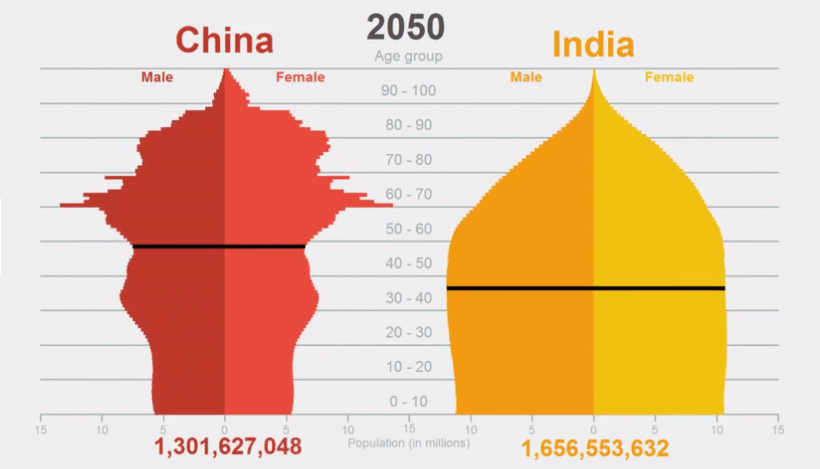
What is 60 -70 ?
400
A graph show how data is distributed and is ordered naturally.
Stem-and-leaf plot
400
Every member has an equal chance of being selected
What is a Random or unbiased sample?
400
The difference between the highest number and the lowest number in a series of numbers.
What is the range?
400
The size of the sample that produces more valid and less bias results.
What is a large sample size?
400
By 2050, whats the median age range in India?
What is 30 -40?
500
Shows least, quartile 1, median, quartile 3, and greatest.
What is a box-and-whisker plot?
500
A type of sampling method that is easy
What is Convenience Sampling?
500
How to get the average of a series of numbers.
What is: add up all of the numbers then divide the sum by the total amount of numbers?
500
Definition of bias.
What is a point of view based on a predetermined idea or prejudice, without any scientific evidence?
500
By 2050, which population have the most under 20 people?
Who is India?