Miscellaneous
Dot Plots
Histograms
Box Plots
100
Which data shows the greatest variability:
Set X: 50, 120, 84, 71, 38, 150, 95
Set Z: 40, 100, 95, 110, 119, 120
Set X
Set X: 150 - 38 = 112
Set Z: 120 - 40 = 80
100
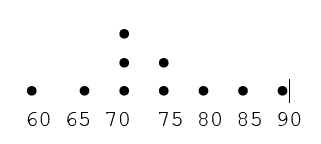
What is the median of this data set?
72.5
The middle is between 70 and 75:
70 + 75 and then divide by 2
100
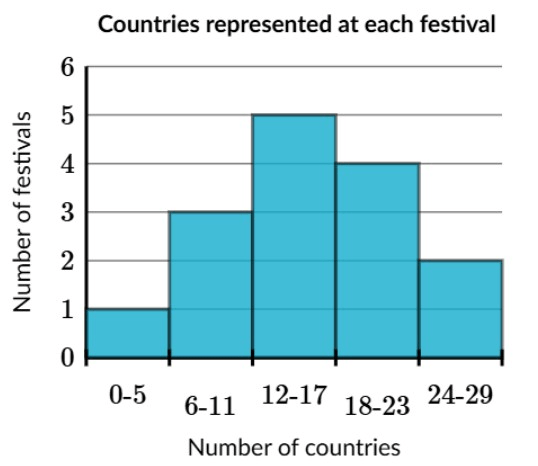
What is the Mean number of countries that participated in festivals?
NO answer.
You cannot determine the Mean from a Histogram. For instance, we can tell that there are 3 festivals celebrated by 6-11 countries, but we don't know for sure if that is 7 countries, 10 countries, etc.
100
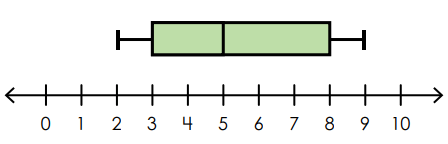
What is the:
Min?
Q1?
Q2?
Q3?
Max?
Min= 2
Q1 = 3
Q2 = 5
Q3 = 8
Max = 9
200
Here are a student's test scores:
100, 97, 81, 68, 95, 85
What is the median?
What is the IQR?
What is the Range?
68, 81, 85, 95, 97, 100
Median: 85+95 = 180/2 = 90
IQR: (Q3 - Q1) 97 - 81 = 16
Range: (Max - Min) 100 - 68 = 32
200
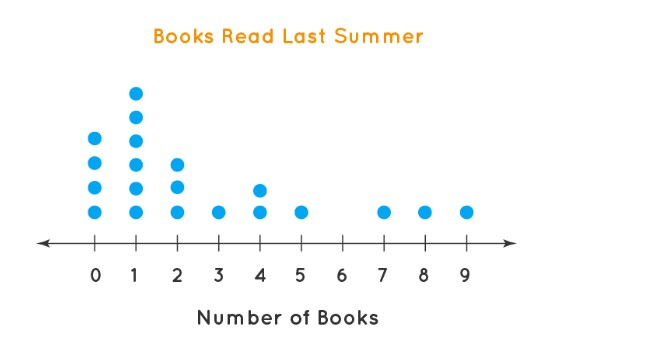
Which statement is true about the data set?
The mean is equal to 2
The mean is less than 2
The mean is more than 2
There is not enough information to determine the mean.
The mean is GREATER than 2 because the mean is 2.6
(0+0+0+0+1+1+1+1+1+1+2+2+2+3+4+4+5+7+9+9)/20
200
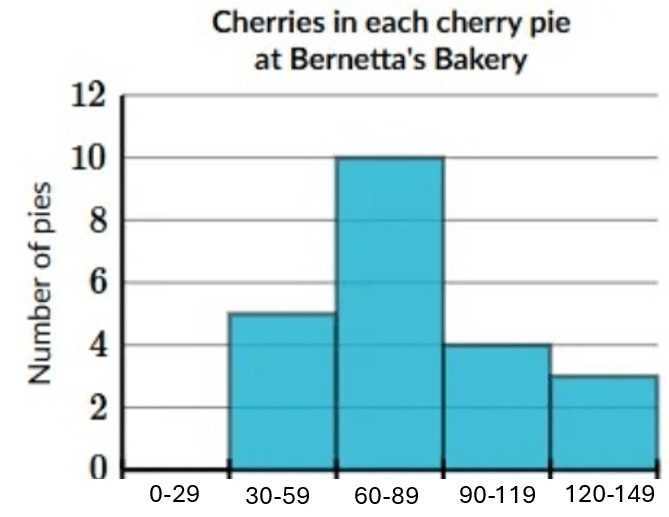
How many pies were counted in this data?
5 + 10 + 4 + 3 = 22 pies
200
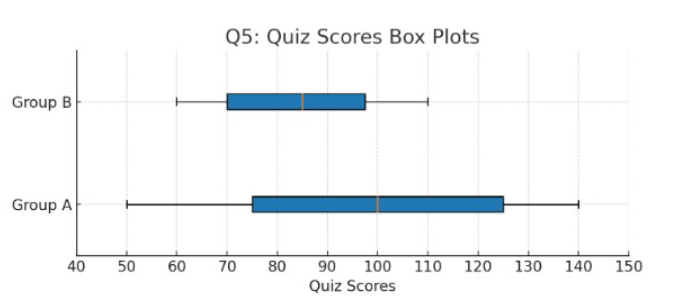
Select all the statements that are true:
A. The range for Group A is Greater than the range for Group B.
B. All students in Group B passed the test (70 or higher)
C. Group A had the highest and lowest score.
D. The median for Group A is Greater than the median for Group B.
E. The mean for Group A is higher than the mean for Group B.
F. 75% of Group B passed the test (70 or higher)
A. The range for Group A is Greater than the range for Group B.
C. Group A had the highest and lowest score.
F. 75% of Group B passed the test (70 or higher)
***Remember: you can NOT find the MEAN from a box plot because you do NOT have ALL of the data numbers - you only have 5 of them.
300
Find the MAD Round the answer to the nearest tenth.
Here are a student's test scores:
100, 95, 78, 83, and 90
MAD: 6.8
Step 1: find the Mean
100+95+78+83+90 =446/5 = 89.2
find the Distance of each data point from the mean:
Data Mean Distance/Difference
100 89.2 10.8
95 89.2 5.8
78 89.2 10.2
83 89.2 6.2
90 89.2 0.8
33.8/5= 6.76 (6.8)
300
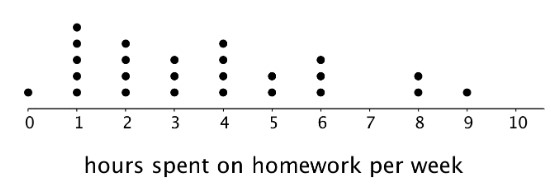
Select the statement that describes the data set:
A. The average hours spent on homework was 5 hours each week.
B. The most common number of hours spent on homework was 9 hours.
C. More than half of the students spend less than 4 hours on homework each week.
D. Students spend between 0 - 10 hours on homework each week.
C. More than half of the students spend less than 4 hours on homework each week.
There are 25 students. Half of 25 is 12.5 hours.
There are 13 students who spend less than 4 hours on homework each week.
300
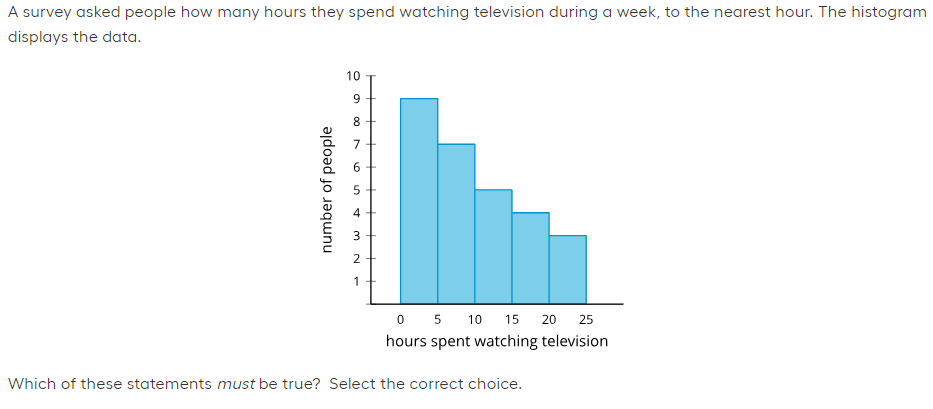
The mode is 5 hours.
The median is somewhere between 10 - 14 hours.
The mean is 8 hours.
There were 28 people who were surveyed for this data.
THERE WERE 28 PEOPLE WHO WERE SURVEYED for this data is correct.
The mode is 5 hours. (The MODE is BETWEEN 0-4 hours)
The median is somewhere between 10 - 14 hours. (5-9 is correct)
The mean is 8 hours. (You can NOT find the mean on a histogram - you don't know the EXACT numbers!!!)
There were 28 people who were surveyed for this data.
YES 9 + 7 + 5 + 4 + 3 = 28 people
300
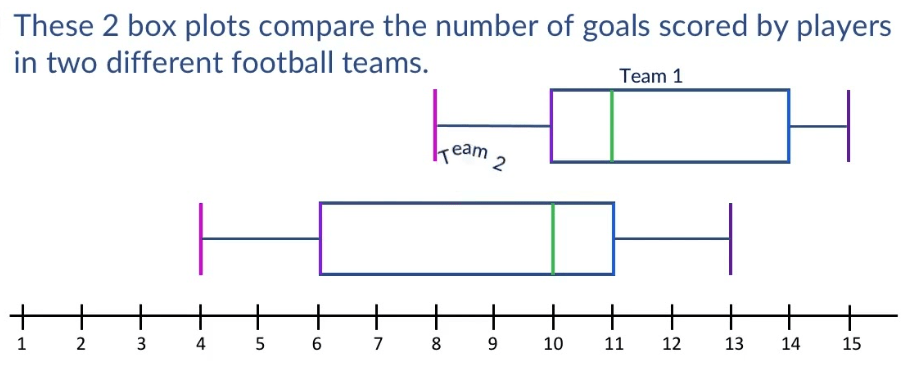
Select all that apply:
A. Team 1 had 50% of their goals scored between 8 and 11.
B. Team 2 had 50% of their goals scored between 10 and 13.
C. 75% of Team 2's goals were between 0 and 10.
D. Team 2 had the lowest and highest goals scored.
E. Team 1 had the highest median.
F. Team 1 had the highest average number of goals scored.
A. Team 1 had 50% of their goals scored between 8 and 11.
B. Team 2 had 50% of their goals scored between 10 and 13.
E. Team 1 had the highest median.
***average and Mean are the same thing - you can NOT tell what the average/mean is from a box plot because you only have 5 of the values and you would need ALL of the values to calculate mean
400
There are 12 players on a basketball team. The median height of the players on the team is 58 inches, and the mean height is 59 inches. The dot plot shows the heights in inches, of some of the players on the basketball team.
There are 2 X's missing that represent the height of 2 missing players. Where should those X's go to have a median of 58 and a mean of 59 inches?
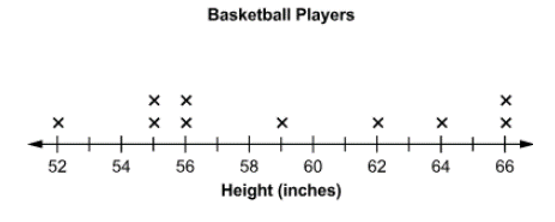
The missing numbers would be 57 and 60
52,55,55,56, 56,57,59,60,62,64,66,66
The median would be between 57 and 59 which is 58
The mean would be the sum of all the numbers/12
708/12 = 59
400
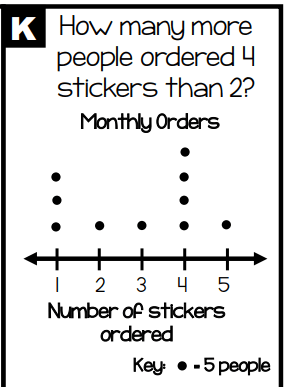
15 more people
4 x 5 = 20 people ordered 4 stickers
1 x 5 = 5 people ordered 2 stickers
20 - 5 = 15 more people
400
What is the MEDIAN number of hours spent on homework?
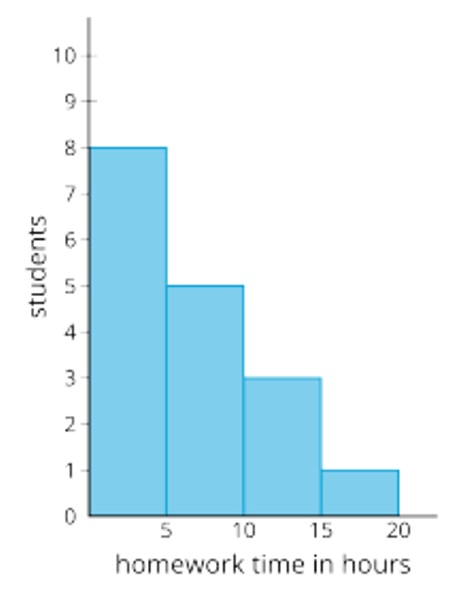
8 + 5 + 3 + 1 = 17
The middle of 17 would be about 8.5 which is in the bar labeled 5-9 hours.
The median would be 5-9 hours.
***You can't give an "EXACT" median because we don't know the exact numbers in each bar.
400
21, 45, 31, 0, 25, 20, 35
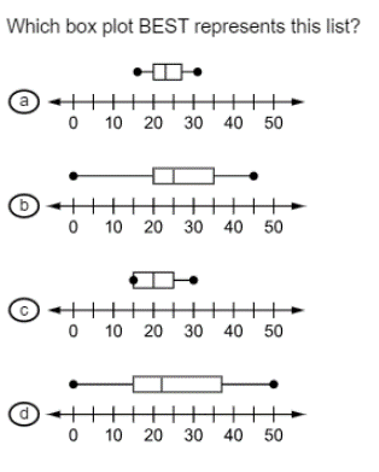
B is the correct box plot
0, 20, 21, 25, 31, 35, 45
Min = 0
Q1 = 20
Q2 = 25
Q3 = 35
Max = 45