Patterns
Graphs
Table
100
What is a variable?
A letter that represents an unknown number.
100
How can you tell if a graph represents a linear relation?
If the points on the graph lie in a straight line.
100
What is a table of values?
A chart showing two sets of related numbers.
200
What is an expression?
Any single number, single variable, or combination of operations involving numbers and variables. An expression does not include an equal sign.
200
Describe the patterns on the graph.

This graph provides data on the length of songs. One song lasts 2 minutes, two songs last 4 minutes, three songs cost 6 minutes... The points appear to lie in a straight line. This graph shows a linear relation. The graph shows that to go from one point to the next, you go one unit horizontally, and two units vertically.
200
The left column or top row of a table of values represents which axis?
The horizontal axis.
300
Identify the pattern.
When the figure number increases by one, the amount of squares increases by two.
300
Does this graph represent a linear relation?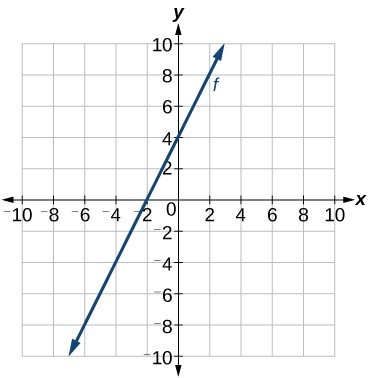
Yes.
300
What do you check for in a table of values to see if the table represents a linear relation?
You check if the consecutive values for the first column increase by the same value, and you check if the consecutive values for the second column increase by an equal amount
400
Make an expression for the following linear relation in section A:
f1+1
f represents figure number
400
Draw a graph that represents this table.
X) 5 10 15 20
y) 100 200 300 400
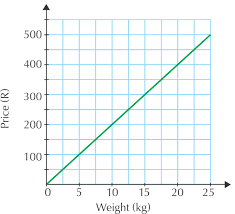
400
Does this table represent a linear relation?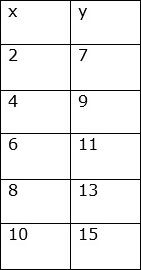
Yes.
500
What is a good strategy to find the next part of a pattern?
Look at the figures. Notice how many squares (or another visual queue) the figure increases by from one figure to the next. Now, try and incorporate that into your expression. For example, if you notice that each figure increases by one square, an expression starting with f*1 might work.
500
Complete the statement. (6), ( )
(6), (29)
500
Does this table represent a linear relation?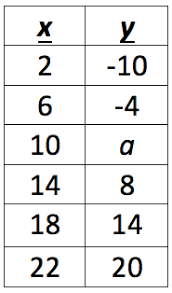
Yes