Qualitative Data
Quantitative Data
Five Number Summary
Misc.
100
What graph could the statistican use to represent his golf ball data?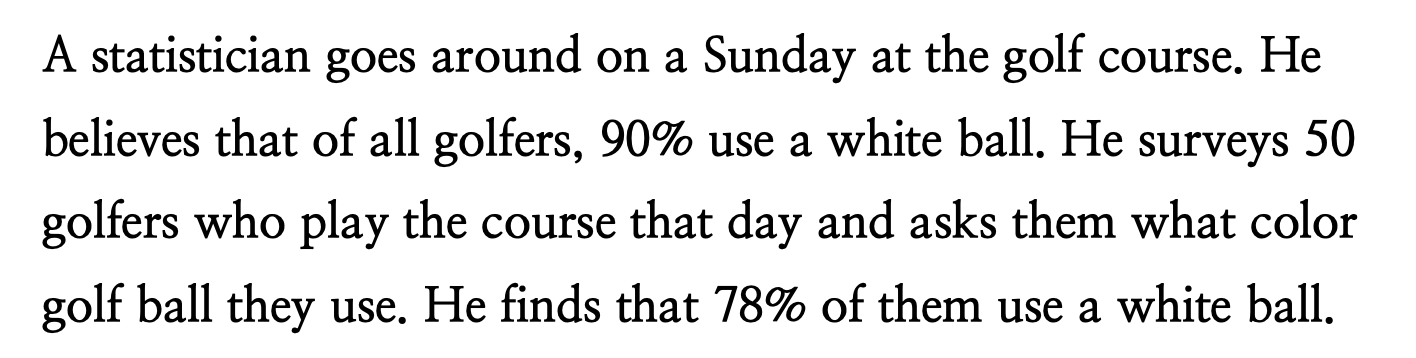
BAR GRAPH ( or maybe pie chart too)
100
Find the mean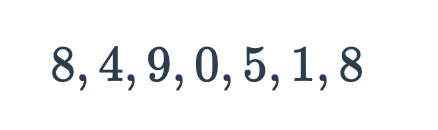
5
100
Find the median
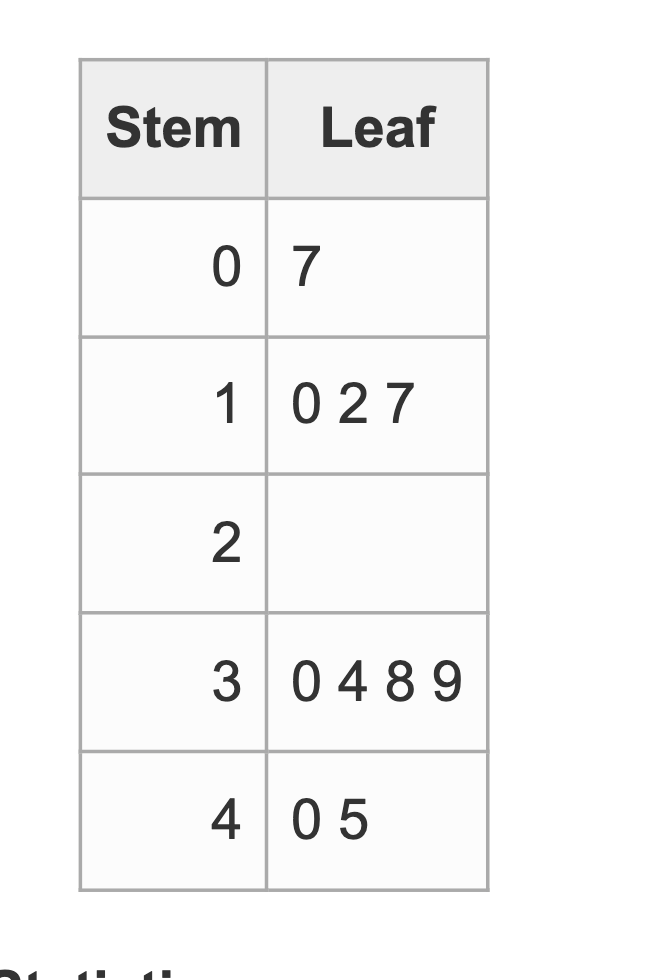
32
100
What's the shape? What's the best measure of center and spread? Why
skew left, median and IQR, there's skew and possible outliers
200
What's the INDIVIDUAL?
Golfers
200
If you forgot a data point, 20, what would be the NEW frequency of its bar on the histogram once you add it?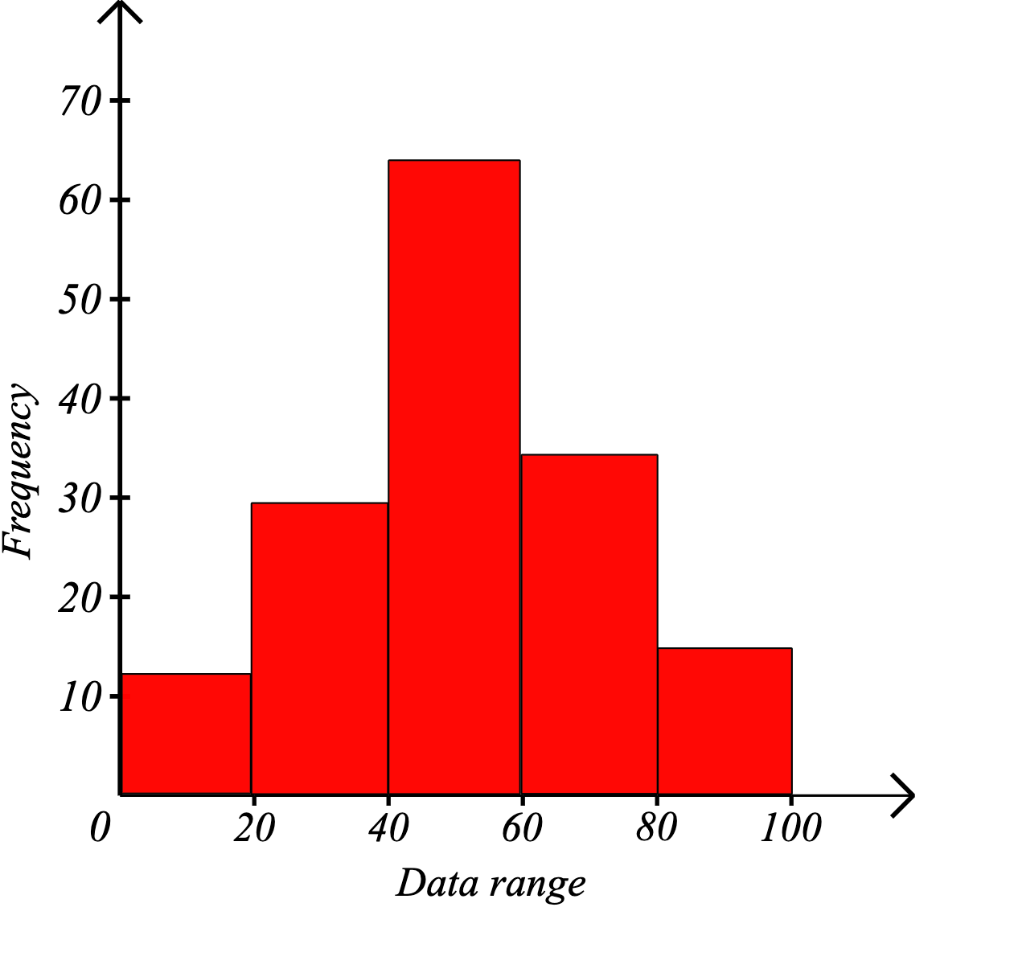
31
200
Find the IQR

14
200
What proportion of females like coffee?
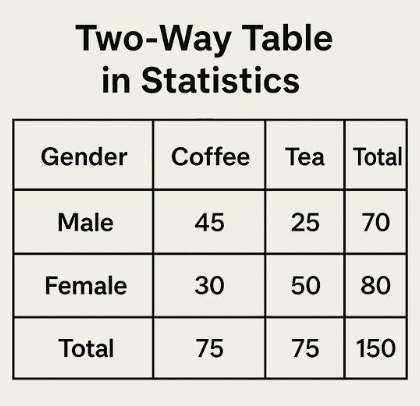
0.375
300
What's the proportion of people who preferred youtube?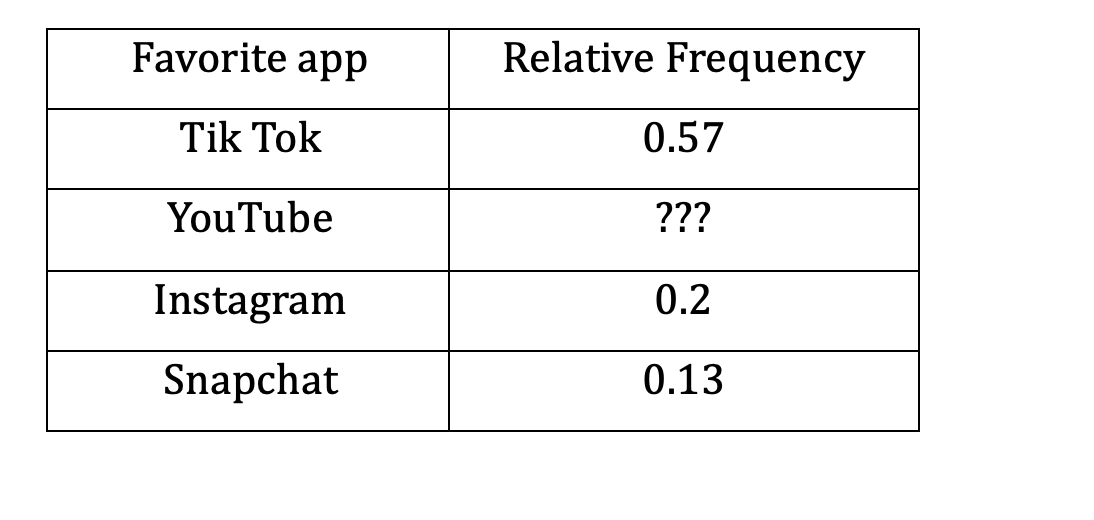
0.1
300
What year was SHS founded?
1970
300
Find the five number summary

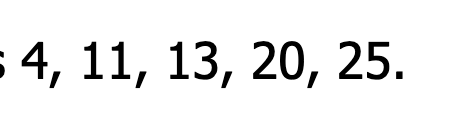
300
What is the statistic?
78%
400
What proportion of students are males who like tea?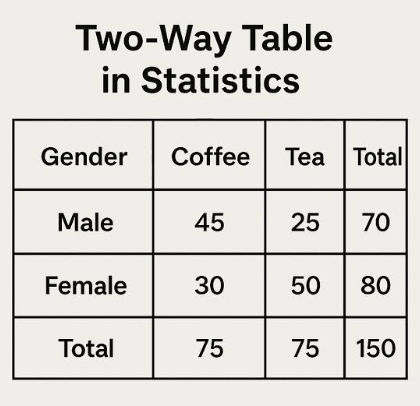
0.167
400
Find the range
54
400
When's the last time the white sox won the world series?
2005
400
How many hearts does an octopus have?
3 <3 <3 <3
500
If you surveyed 300 people, how many would you expect to NOT pick Tik Tok?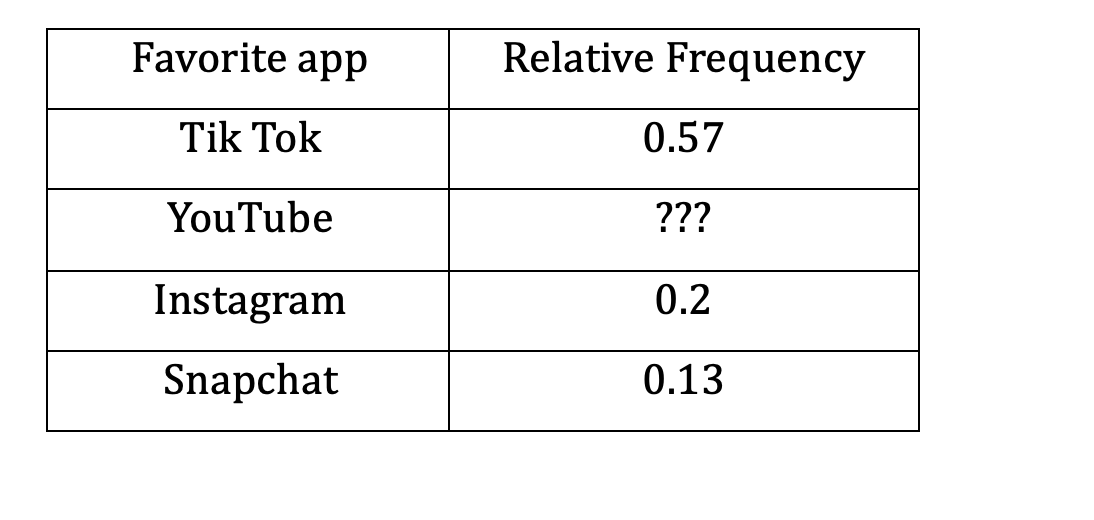
129
500
If you surveyed 2540 people, how many would you expect to $150-$250?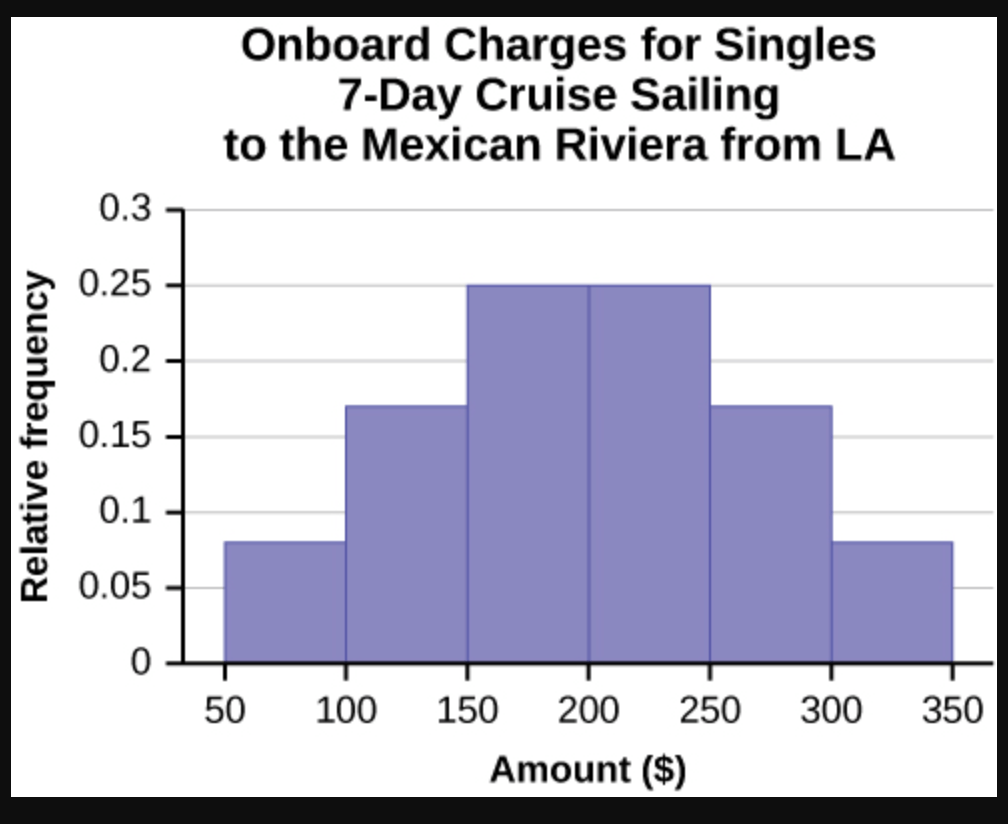
1270 people
500
What are the BOUNDARIES for good data? Are there any outliers?
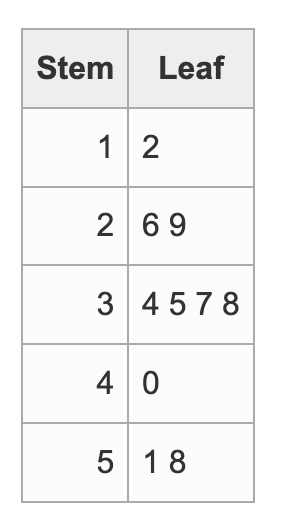
(12.5, 56.5) outlier of 12 and 58
500
Find the missing number
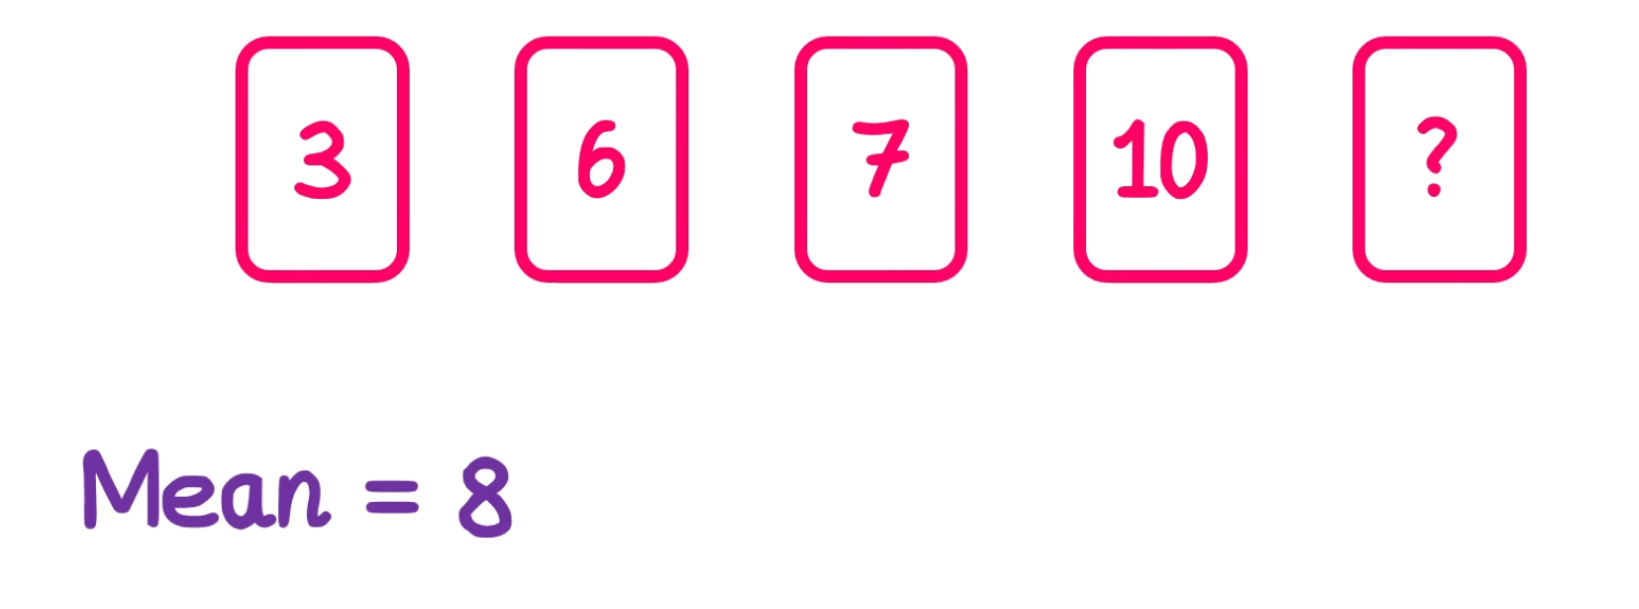
14