Mean
Medium
Mode
Identify outliers and their impact
Circle Graphs
100
The test scores are shown below:
80, 90, 70, 100, 60
What is the mean score?
80
100
Find the median of:
21, 18, 25, 30, 27, 24, 15
24
100
Find the mode of:
4, 6, 6, 8, 10
6
100
Identify the outlier in this data set:
5, 6, 7, 8, 30
30
100
If you have 20% what is that out of?
100% (20% out of 100%)
200
The mean of four numbers is 25.
What is the total of the four numbers?
100
200
The data set is:
29, 18, 20, 25, 23
What is the median?
23
200
Find the mode of:
12, 15, 12, 18, 20, 15, 12
12
200
The data set shows the number of books students read:
4, 5, 6, 5, 4, 20
What is the outlier, and what effect does it have on the mean?
Outlier is 20
Increased the mean
200
Two hundred (200) people were asked about their favorite pet. The circle graph shows:
- Cats: 50%
- Dogs: 35%
- Fish: 15%
How many people liked dogs the most?
70 people
300
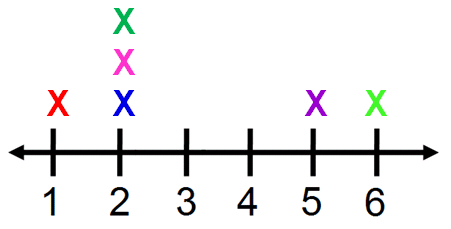
What is the balance point?
3
300
A class recorded the number of minutes students studied:
12, 15, 18, 20, 24, 27, 30, 35
What number could be added to the data set so the median stays the same?
22
300
The number of books read by students is:
3, 5, 4, 5, 6, 7, 5, 8, 7, 6
What is the mode?
5
300
22, 24, 21, 23, 90, 25
Would the outlier make the mean larger or smaller?
larger
300
Two hundred (200) people were asked about their favorite pet. The circle graph shows:
- Cats: 50%
- Dogs: 35%
- Fish: 15%
How many people liked either cats or fish the most?
130
400
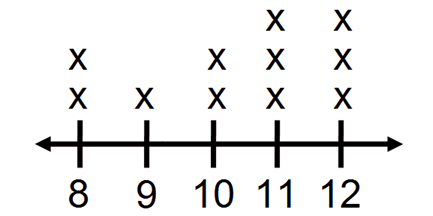
What is the balance point?
10.36 or 10.4
400
The data set is:
11, 14, 18, 20, 22, 25, 29
If the number 18 is removed, what is the new median?
21
400
The data set is:
40, 45, 45, 50, 55
If another 50 is added to the set, what happens to the mode?
Then list all modes.
Changes from 45 to having both 45 and 50
400
78, 80, 82, 79, 81, 25
What is the outlier?
Would the median change a lot or only a little because of the outlier?
Does it make the score higher or lower?
25 is the outlier
Changes the number a lot - making it go down
400
A population of 250 people was surveyed on what type of music they liked best. The results were recorded in the circle graph. How many more people preferred country music (28%) than alternative (16%)?
30 people
500
The mean of these numbers is 18:
12, 16, 20, 24, ___
What missing number makes the mean 18?
18
500
The data set is:
45, 48, 50, 53, 57
If 90 is added to the set, what happens to the median?
Then find the new median.
increases
51.5 new median
500
A class recorded the number of minutes students studied:
15, 18, 18, 20, 22, 22, 22, 25, 25
If another 25 is added to the data set, what happens to the mode?
Then find the new mode(s).
The old mode was 22
The new modes are both 22 and 25
500
A scientist recorded these plant heights in centimeters:
21, 22, 20, 23, 24, 85
- Identify the outlier.
- Find the mean with the outlier included.
- Predict how the mean would change if the outlier were removed.
- What is the new mean?
Outlier - 85
Mean with outlier - 32.5
The mean would decrease if the outlier were taken out
New mean - 22
500
A population of 300 people was surveyed on what type of music they liked best. The results were recorded in the circle graph. How many more people preferred rock (32%) to country music (16%)?
48 people