Read the Line
Race to the Spotlight
Do the Math
Hit the Brakes
Reaction Distance
100
On a distance–time graph, a flat (horizontal) line means the object is doing this.
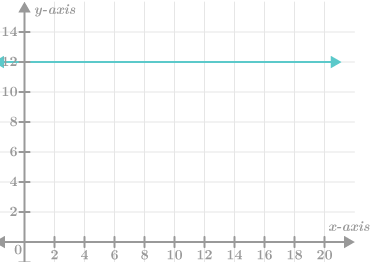
What is Not moving / stopped ?
100
Two cars' lines on a distance–time graph both go flat at 15 m. Which car traveled farther?
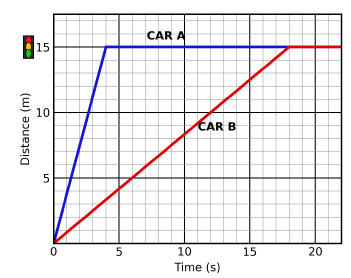
What is Neither, both traveled 15 m
100
Speed = distance ÷ ___
What is Time?
100
The distance a car travels between the driver seeing danger and hitting the brakes.
What is Reaction Distance?
100
On a speed–time graph, a flat line above zero means this.

What is Constant speed (not stopped!)
200
The slope of a distance–time graph tells you this.
What is Speed?
200
Car A reaches the stoplight in 9 s. Car B takes 3 s. Whose line is steeper?
What is car B?
200
A skateboarder rolls 12 m in 4 s. Speed?
What is 3 m/s?
200
Distance = _____ x Time
What is Speed?
200
On a speed–time graph, the car is stopped when the line is here.
Where is At zero, on the time axis?
300
Line A is steeper than Line B on the same distance–time graph. Which object is faster?
What is A (steeper = faster)?
300
Car A's line goes flat at 4 s. Car B's goes flat at 15 s. How much longer did Car B take?
What is 11 s (15 − 4) ?
300
A car travels 90 m in 6 s. Speed?
What is 15 m/s?
300
A car is going 10 m/s. The driver's reaction time is 0.8 s. Reaction distance?
What is 8 m ?
300
t1: driver sees an obstacle.
t2: driver hits the brakes.
What does the speed do between t1 and t2?
What is Stays the same; the driver is still reacting ?
400
A straight diagonal line on a distance–time graph means the speed is doing this.
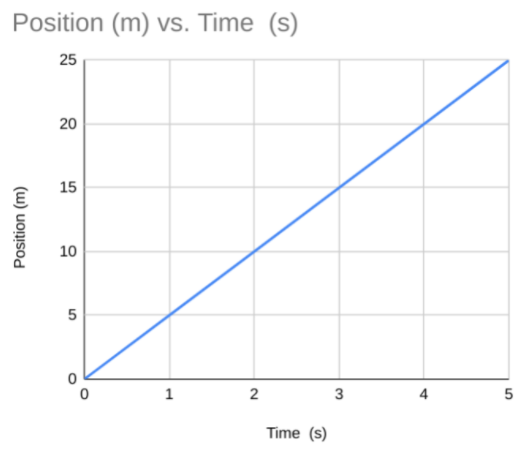
What is Staying constant ?
400
Two cars' lines on a distance–time graph are parallel. What does that tell you?
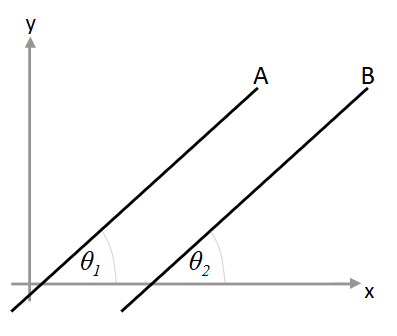
What is They have the same speed ?
400
A line on a distance–time graph goes from (0 s, 0 m) to (8 s, 20 m). Speed?
What is 2.5 m/s
400
A driver at 25 m/s is texting, and their reaction time doubles from 0.8 s to 1.6 s. New reaction distance?
What is 40 m (up from 20 m) ?
400
Which part of a speed–time graph shows the car braking?
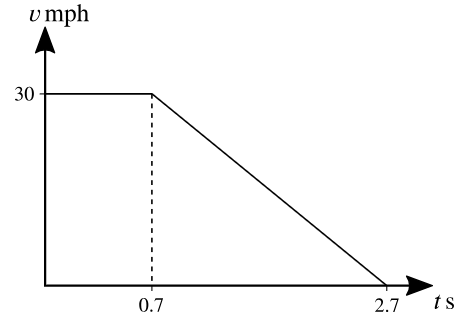
(Description from student)
500
A line on a distance–time graph starts shallow and curves to get steeper and steeper. What is the object doing?
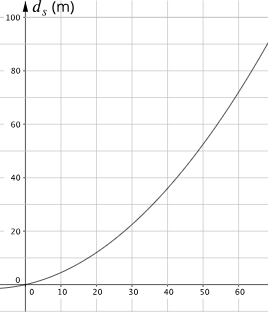
What is speeding up?
500
Both cars stop at 18 m. Car A gets there in 2 s, Car B in 12 s. What's the difference in their speeds?
DAILY DOUBLE
What is (A = 9 m/s, B = 1.5 m/s)?
500
A line goes from (2 s, 5 m) to (6 s, 25 m). Speed?
What is 5 m/s?
500
Reaction time stays 1 s, but speed drops from 30 m/s to 15 m/s. How much shorter is the reaction distance?
What is 15 m shorter (30 m → 15 m, cut in half)
500
A distance–time graph shows a car stopping with a perfectly sharp corner. Why isn't that realistic?
What is Real cars can't stop instantly. Braking takes time and distance, so the line should curve gradually into the flat part?