Experimental Design
Metric Match Up
Metric Conversions
Ruler Ready
Graph It
CER Challenge
Final Jeopardy: Experimental Design and Graphs
100
A testable prediction often written in the form “If…, then….”
What is Hypothesis
100
Best unit for the thickness of a sheet of paper.
What is Millimeters (mm)
100
How many meters are in 1 kilometer?
What is 1,000 meters
100
To find the distance between two ruler points, do this operation.
What is Subtract the smaller measurement from the larger measurement
100
On a graph, the independent variable belongs on this axis.
What is x-axis
100
The part of CER that states your answer to the question.
What is Claim
200
The variable a scientist purposely changes.
What is Independent variable
200
Best unit for the length of a classroom desk.
What is Centimeters (cm) or Meters (m)
200
Use the metric chart. How many places do you move the decimal when converting from kilometers to meters, and which direction do you move it?
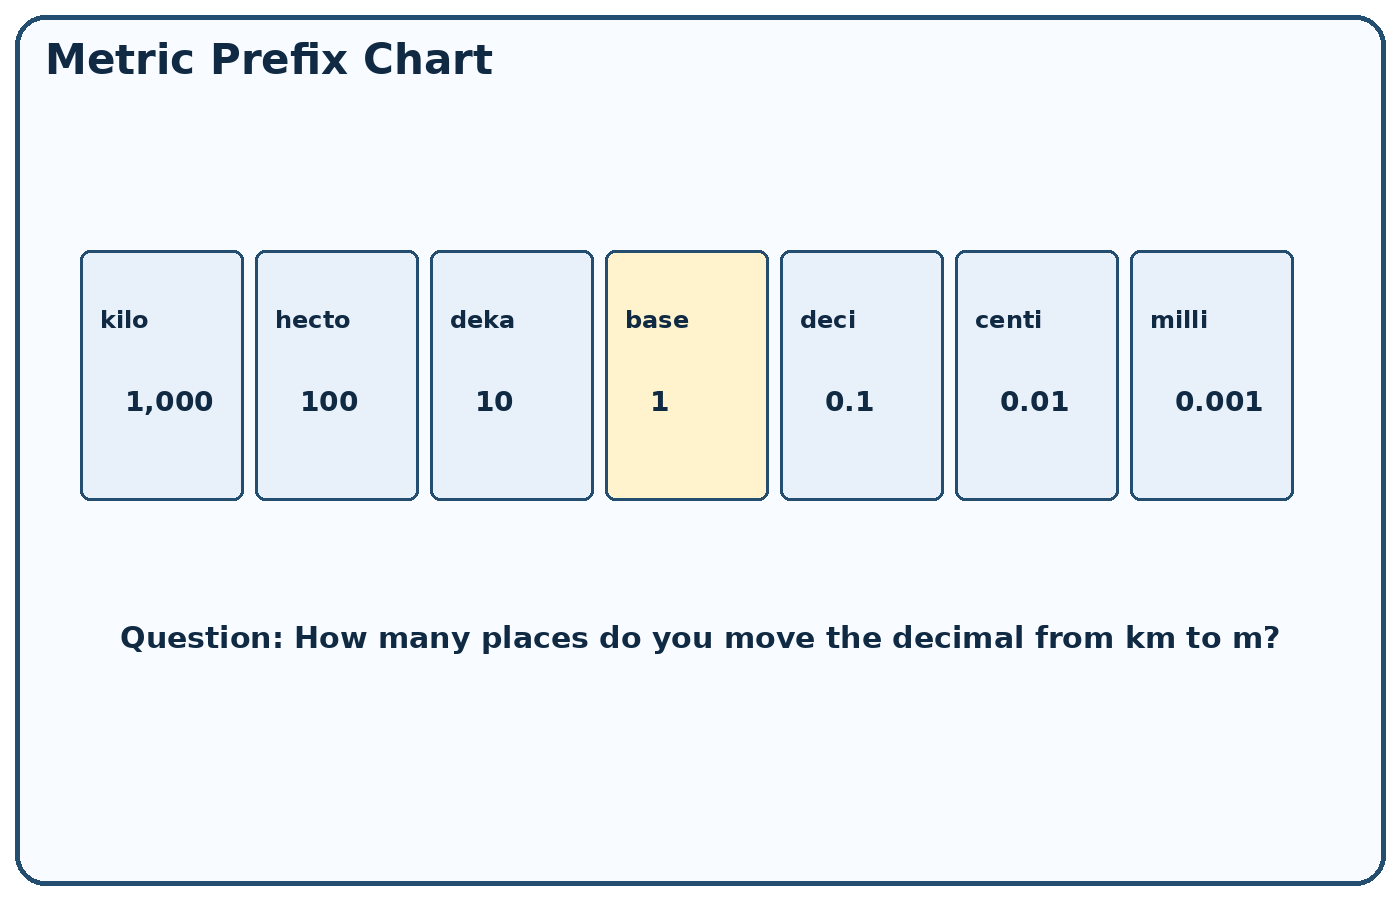
What is Move the decimal 3 places to the right.
200
Use the ruler in the picture. What is the distance from Point A to Point B? Include units
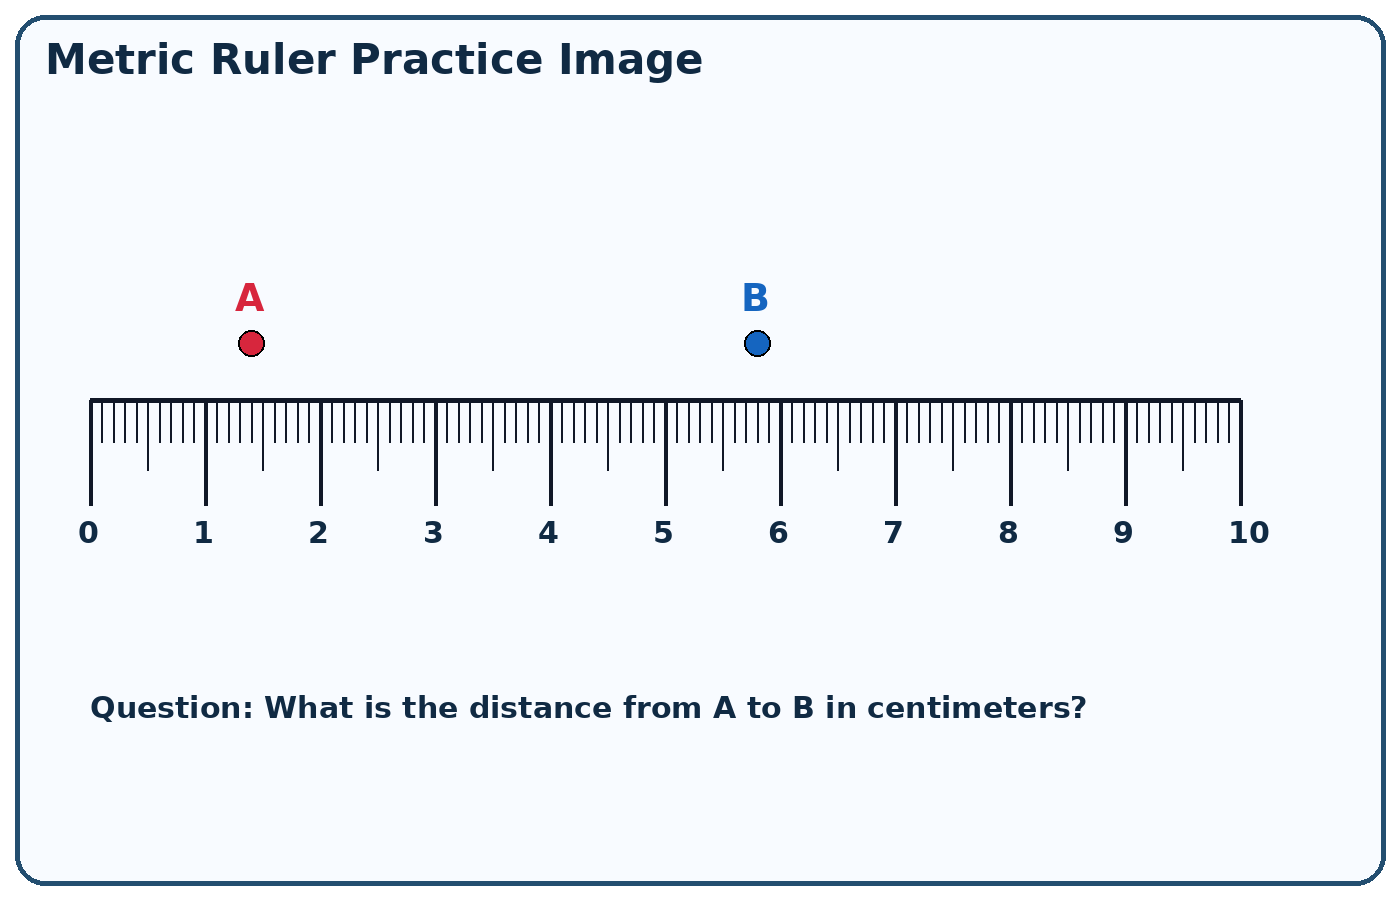
What is 5.8 cm - 1.4 cm= 4.4 cm
200
On a graph, the dependent variable belongs on this axis.
What is y-axis
200
The part of CER that gives data, facts, or observations.
What is Evidence
300
The variable a scientist measures or observes.
What is Dependent variable
300
Best unit for the height of a tall building.
What is Meters
300
Convert 2.8 km to m.
What is 2,800 m
300
A line begins at 0.7 cm and ends at 6.2 cm. Find the distance.
What is 5.5 cm
300
Write a better title for this graph using the format: “The Effect of the _ on the _.”
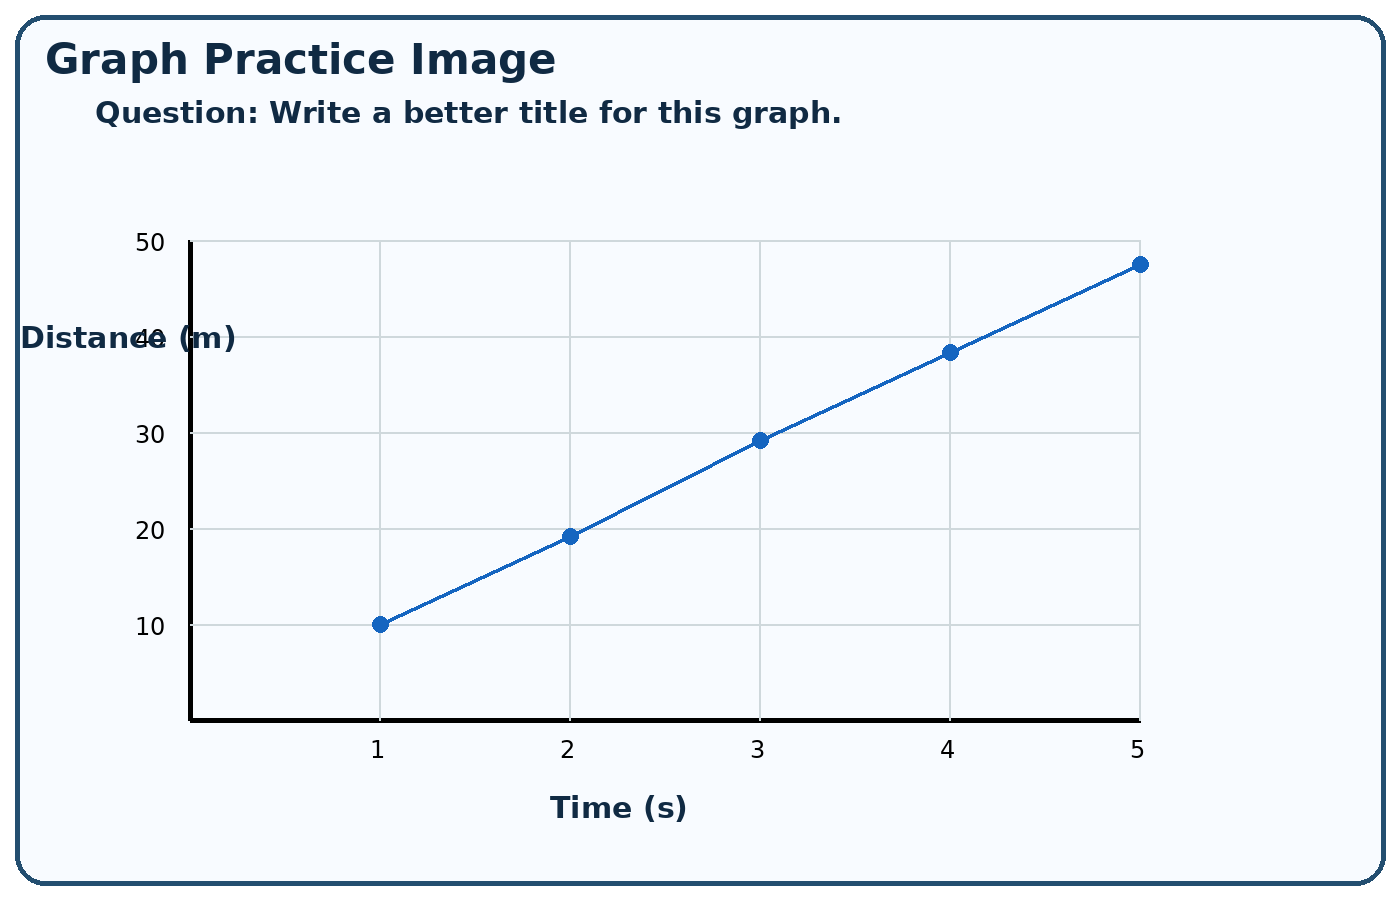
What is The Effect of Time on Distance.
300
The part of CER that explains how evidence supports the claim.
What is Reasoning
400
The baseline group used for comparison in an experiment.
What is Control
400
Best unit for the distance between two cities.
What is Kilometers (km)
400
Convert 725 mm to cm.
What is 72.5 cm
400
There are this many millimeters in 1 centimeter.
What is 10 mm
400
A student changes the mass on a cart and measures its acceleration. Name the x-axis variable.
What is mass on the cart
400
A test shows that plants given 20 mL of water grew 8 cm, while plants given 5 mL grew 3 cm. Give one piece of evidence.
What is Plants given 20 mL of water grew 8 cm, while plants given 5 mL grew 3 cm
500
A student changes the type of soil and measures tomato plant height. Name the independent variable and dependent variable.
What is IV: type of soil; DV: tomato plant height
500
A ribbon is 3.25 m long. Name a reasonable metric unit for measuring the ribbon and explain why.
What is Meters; the ribbon is several base-unit lengths long, so meters are appropriate
500
Use dimensional analysis to convert 3.6 m to cm.
What is 3.6 m × (100 cm / 1 m) = 360 cm
500
A segment begins at 2.35 cm and ends at 8.10 cm. Find the distance with the correct unit.
What is 5.75 cm
500
A student changes the length of a pendulum and measures the time for one swing. Write a complete graph title.
What is The Effect of Pendulum Length on Time for One Swing
500
Use the bucket-and-pipe diagram. Which bucket will fill first? Write a claim and support it with at least two facts from the diagram.
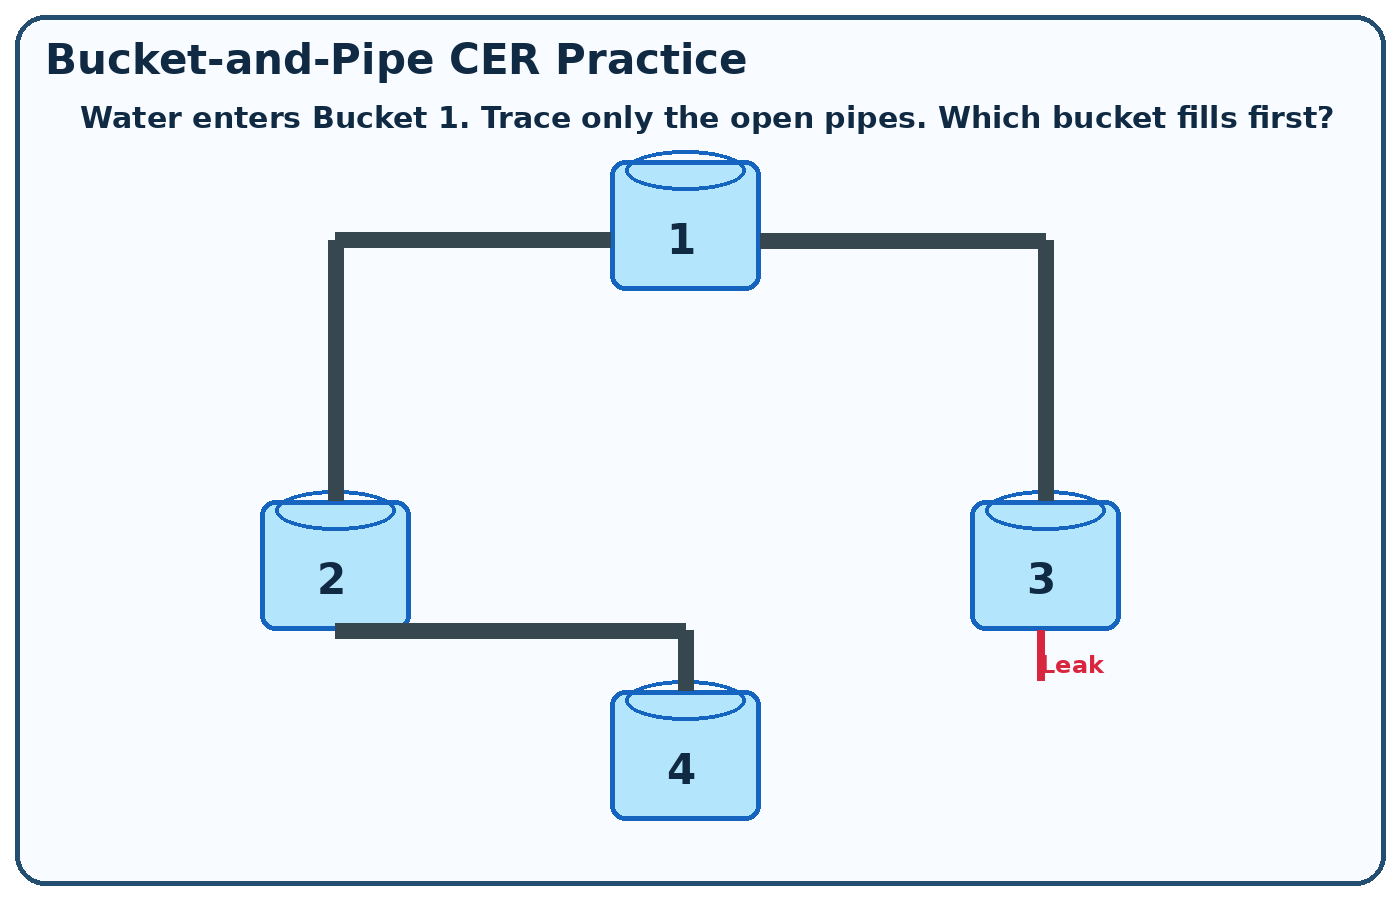
What is Bucket 4 will fill first. Water enters Bucket 1; an open pipe leads from Bucket 1 to Bucket 2, and another open pipe leads from Bucket 2 to Bucket 4. Bucket 3 leaks, so it will not fill.
500
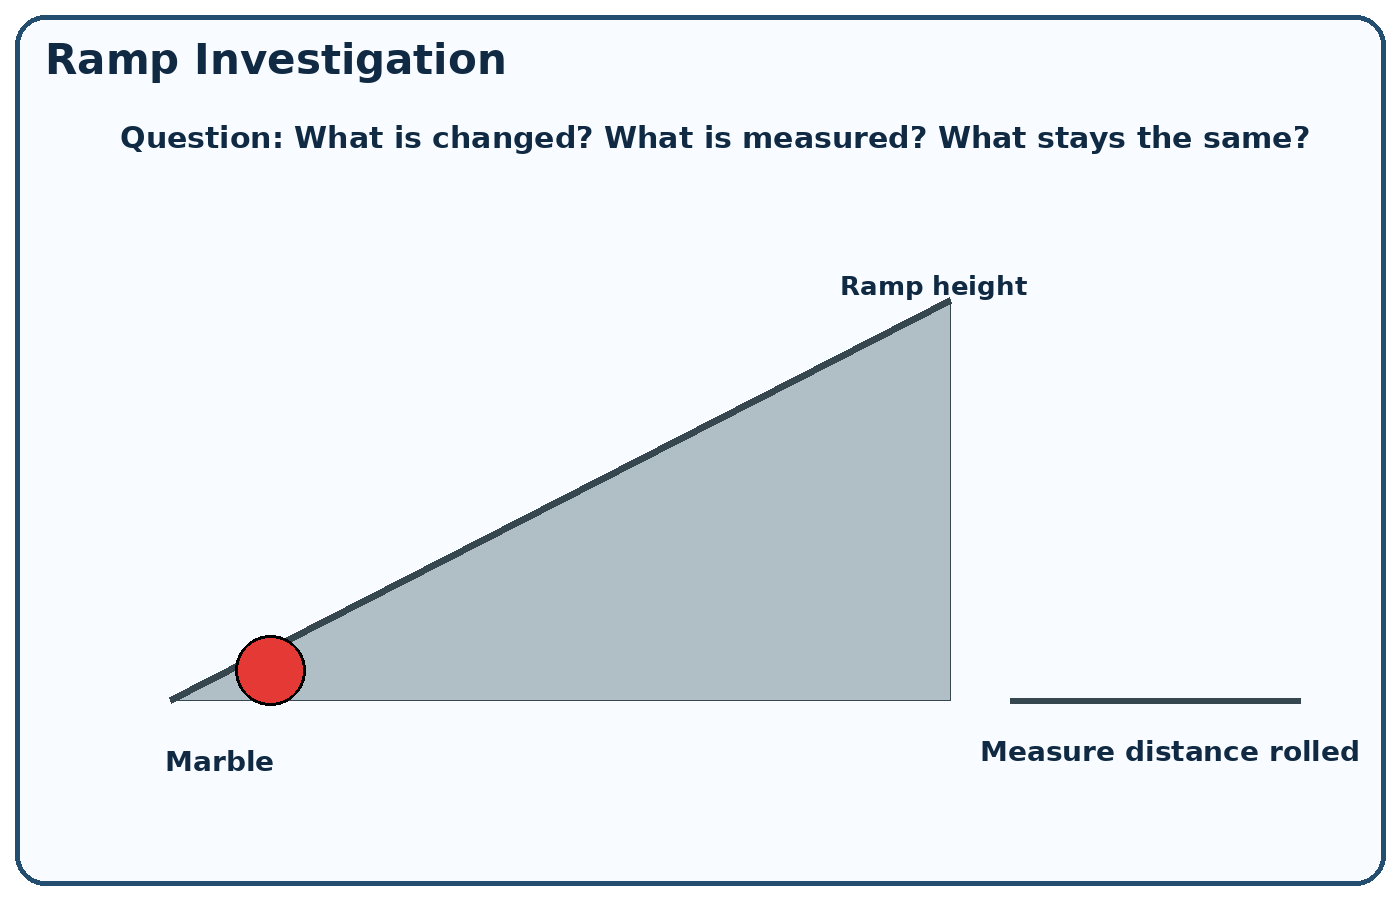
A student tests whether the height of a ramp affects how far a marble rolls. Identify the independent variable, dependent variable, and one constant. Then write an “Effect of…” graph title.
What is
Independent variable: ramp height
Dependent variable: distance the marble rolls
Constant: the marble, surface, or release point
Graph title: The Effect of Ramp Height on Distance the Marble Rolls