Categorizing Data
Categorical Data
Quantitative Data
Random Stats
Misc.
100
John is getting ready for his fantasy football draft. To help him decide who to draft, he collects the stats on the top 100 players in the NFL. He looks at each players passing yards, rushing yards, receiving yards, touchdowns, jersey number, team name, tackles, and sacks.
What is/are the individuals of this data set?
The top 100 players in the NFL
100

22%
100
Estimate the center of this distribution.
About 20
(I will not accept anything 16 or less
or 24 or more)
100
How many squares are on a chessboard?
64
100
On the second day of school we did an activity about a woman named Joy. What did Joy think she could smell on her husband?
Parkinson's
200
What type of variable is the number of passing an NFL quarter back has in a game.
Quantitative
200
What is wrong with this Bar Chart?
The vertical axis does not start at 0.
It makes the difference in conversion rates seem larger than it is.
200
What is the label we use for a data point that is significantly higher or lower than the rest of the data.
Outlier
200
What percent of the earth is covered in water?
71%
200
What college level sport competes in the Bean Pot?
Bonus: +100 for every named college that competes
Hockey:
Bonus: Boston College, Boston University, Harvard, and Northeastern
300
What type of data are zip/postal codes?
Example: 01880, 01952, 02112
Categorical
300
What is wrong with this bar chart? 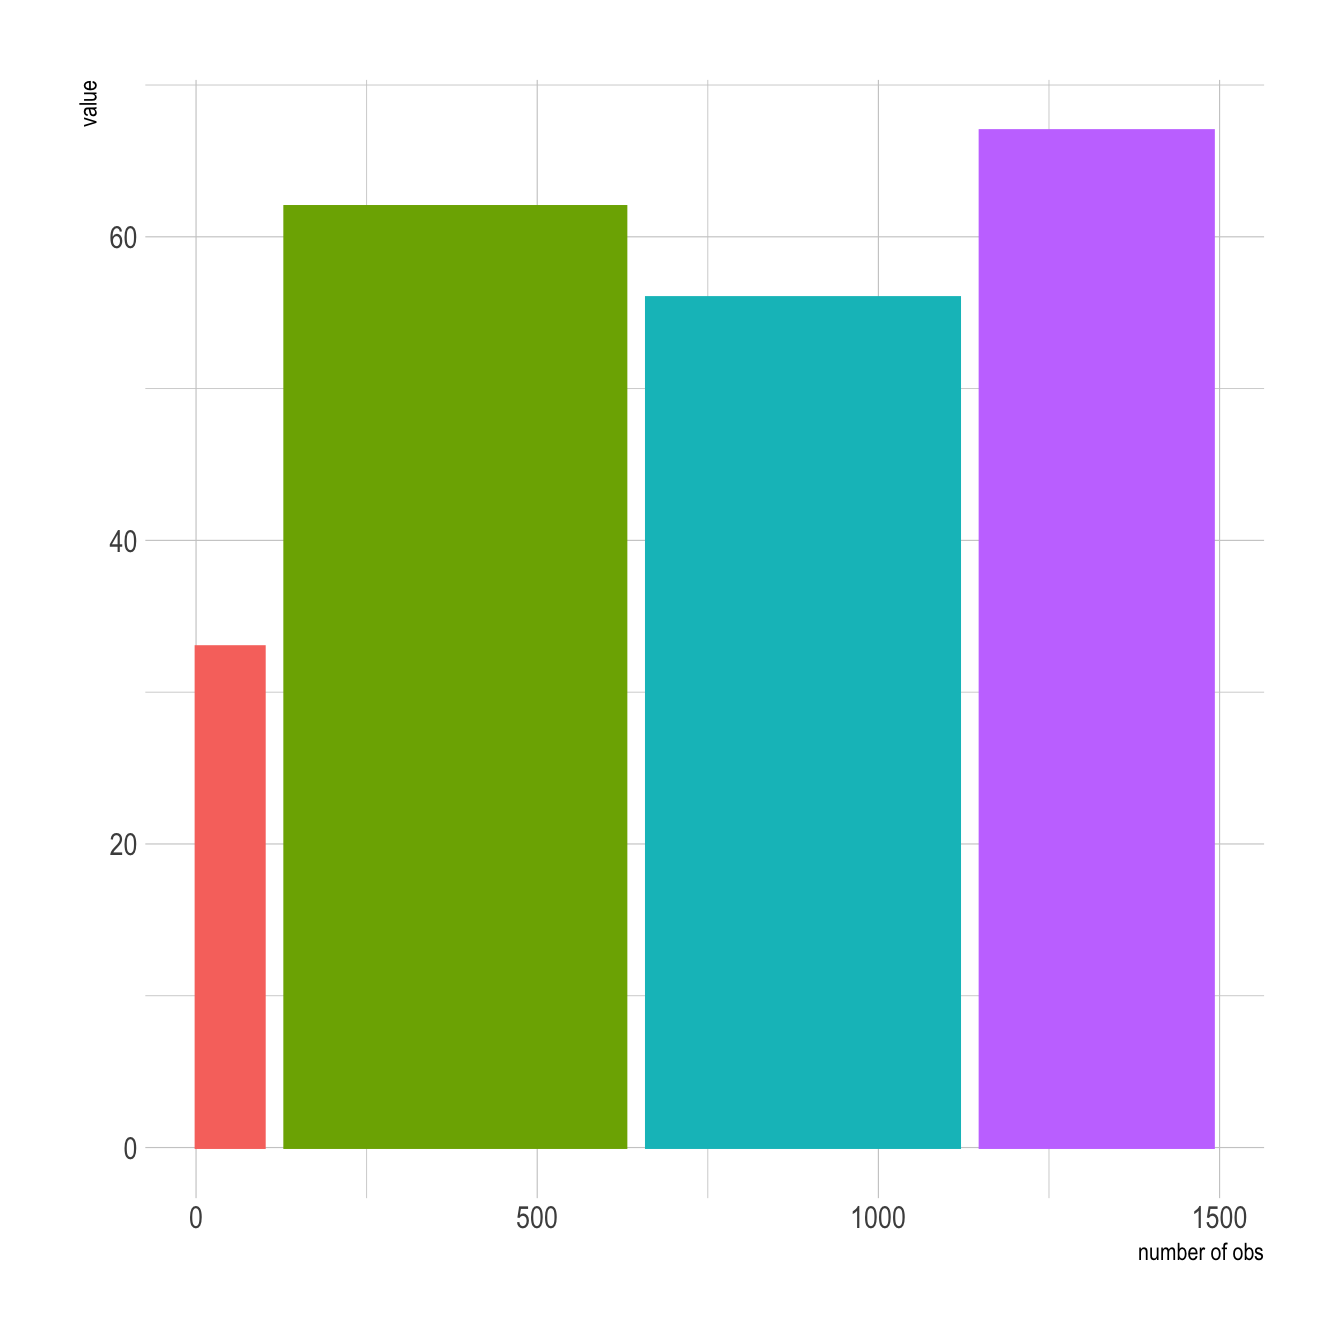
The bars are not the same width.
300
Describe the shape of the date data.
"Roughly" Uniform
300
What percentage of people are estimated to be left-handed?
10 %
300
What was the original name of the New England Patriots when they were founded in 1959?
Bonus +200: Prior to changing to the New England Patriots, they went by one other name. What was it?
Boston Patriots
Bonus: Bay State Patriots
400
What is quantitative data?
numerical values where it makes sense to take the mean.
400
What is wrong with this Bar Chart?
The bars do not have a space in between them.
This makes it look like a histogram and implies that the labels on the bottom axis are ranges.
400
How do you describe the variability of a data distribution?
Find the range:
Maximum value - Minimum Value
400
A standard die is rolled on a flat surface.
If the number shown is a 3, what is the likelihood that the number side touching the table face down is a 5?
Your answer should be a percentage or fraction.
0%
Opposite sides on a standard die have a sum of 7.
400
Which artist has the most Grammy Awards of all time?
Beyoncé
500
Provide 2 examples of numerical data points that are not quantitative.
You may not use examples already mentioned in this games.
Ms. Stapleton will verify your answer.
500
Why don't we use shape of graph to describe categorical data and bar graphs?
The order of the bars is irrelevant to the data. Reordering the bars, changes the shape of the graph.
500
Describe the shape of this Stem Plot for the pulse rate before excursing.
Skewed Right
500
What percent of the worlds population lives in the northern hemisphere?
90%
500
Name one of the only two mammals that lay eggs?
Anteater and Platypus