Which Test to use?
Interpreting Test Results
Test Assumptions
Spot the Error
Vocabulary
Using and Reading Jamovi
100
Measuring Anxiety in the same participants before and after a mindfulness workshop
Paired Samples t-test (Matched Pairs t-test)
100
A result of p = .03 leads to this decision regarding the null hypothesis
Reject the null hypothesis
100
The assumption that scores are approximately bell-shaped in the population
Normality
100
A teacher compares quiz scores between a lecture class and a flipped class using an independent samples t-test. She finds t(28) = 0.94, p = .36, and writes: “Because p is greater than .05, we fail to reject the null hypothesis and have proven that the two teaching methods are equally effective.”
We don't "prove" things in science.
100
Rejecting a null hypothesis that is actually true
Type 1 Error
100
What I need to do to test whether the population from which Group A's was sampled has a mean attitude above 35. Assume I've passed Shapiro-Wilk.
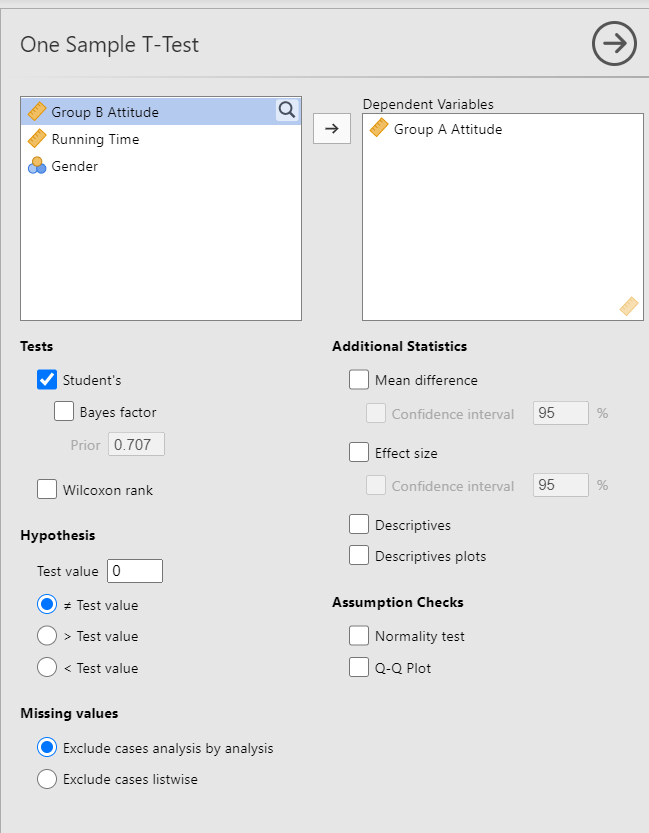
Enter "35" into the test value box and then click "> Test value"
200
Comparing the exam scores of a sample of 30 students in a school to a known national average score of 75 points to see if all of the students at the school have a higher or lower average than 75 points.
One-Sample t-test
200
d = .25. How should we describe the size of that difference in a single word?
small
200
The dependent variable for t-tests and ANOVA must be measured as one of these variable types (there are two options, name both)
interval or ratio
200
A coach records the sprint times of the same 25 athletes before and after a 6-week training program. He runs a paired samples t-test and reports t(24) = 2.31, p = .025, concluding the program improved sprint times.
statistical letters aren't italicized
200
The hypothesis that states there is no difference, no correlation between variables, or no effect
null hypothesis
200
The tab at the top of jamovi where you find the T-Tests and ANOVA menus:

Analyses
300
Comparing mean GPA across freshmen, sophomores, juniors, and seniors
One-way ANOVA
300
t(24) = 1.20, p = .24 leads to this conclusion regarding the null hypothesis
Fail to reject the null hypothesis
300
Your fallback if you fail the Shapiro-Wilk test.
The Central Limit Theorem (which requires a large sample size)
300
A coffee shop owner wants to know if her cups are filled with an average of 12 ounces. She samples 30 cups and writes her hypotheses as H₀: The sample mean = 12 and H₁: The sample mean ≠ 12, then runs a one-sample t-test.
hypotheses are about the population, not the sample.
300
Failing to reject a null hypothesis that is actually false
Type II Error
300
What boxes to check before looking at results of the indpeendent samples t-test:
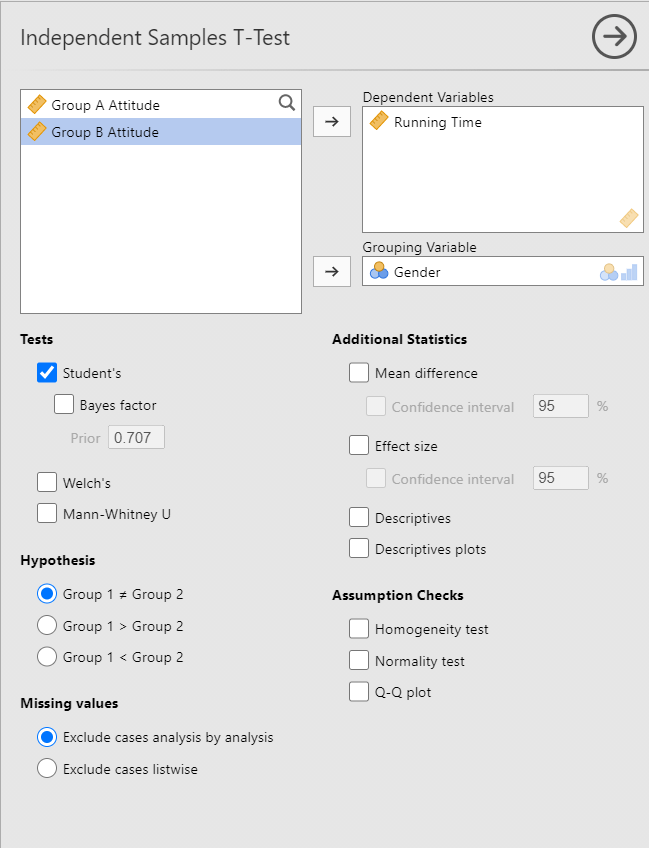
Homogenity test and Normality Test
400
Researchers pair up sets of twins and assign one twin to treatment and the other to control
Paired Samples t-test (Matched Pairs t-test)
400
For Group A, M = 82. For Group B, M = 76, t(48) = 2.45, p = .018. Is there a statistically significant difference, and if so, in what direction?
Group A is statistically significantly higher than group B.
400
The assumption that Levene's test tests for.
homogenity of variances/homoskedasticity
400
A researcher compares two study apps with 500 students per group. App A averages 70.8 and App B averages 70.2 on a 100-point exam. The t-test gives p = .001, and she writes: “Because the p-value is so small, App A has a huge effect on exam performance.”
p-values only tell you about statistical significance, not practical significance. A trivial difference can be statistically significant with a large sample size.
400
A standardized statistic for reporting group differences in mean.
Cohen's d
400
In the Independent Samples T-Test window, this is the box where you input a categorical variable
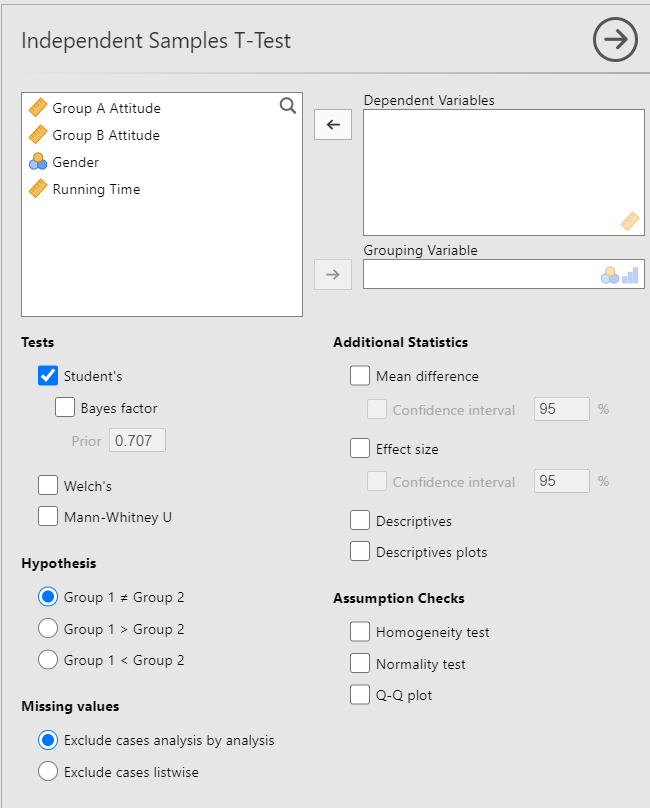
Grouping Variable Box
500
Comparing reaction times of an energy-drink group and a water group made up of different people
Independent samples t-test
500
You run a standard one-way ANOVA and get: F(2, 57) = 6.84, p = .002. What should you do next?
Run a post-hoc test.
500
The independent samples t-test you should run if you get Levene's test p = .03.
Welch's t-test
500
A student compares the commute times of 15 students who drive and 20 students who take the bus. Using an independent samples t-test, she reports her results as t(34) = 2.12, p = .04, and concludes drivers have shorter commutes.
The degrees of freedom should be 33, not 34. There are 35 students, and the df for indpendent samples t-test is n-2.
500
A hypothesis that predicts the direction of a difference uses this kind of test
One-tailed (or directional) hypothesis
500
Describe which groups are different from which other groups in their ratings of the tastiness of a new brand of cracker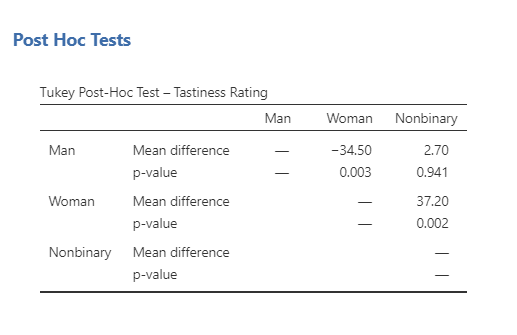
Women found the crackers tastier than men and than nonbinary people, but men and nonbinary people had no statitsically signficiant differences.
600
A researcher with 5 separate groups runs three separate independent samples t-test. This is the test they should have used instead to avoid inflating their familywise error rate.
One-way ANOVA
600
p = .04 does NOT mean a 4% chance the null is true. What does it actually mean? Include "4%" in your answer.
The probability of getting results as extreme as we got in world where the null hypothesis was true if we were to re-sample over and over again infinitely from the sample population is 4%.
600
Assuming Levene's p = .73, Shapiro-Wilk p = .02, and n = 83. What test should you run to compare two separate groups?
Student's t-test
600
A psychologist compares stress levels across four work schedules using a one-way ANOVA and finds F(3, 76) = 5.92, p = .001. Based on this they write: “The results show that all four work schedules produce significantly different stress levels from one another.”
A post-hoc test is needed to determine which schedules are different from which other schedules. We only know there is at least 1 difference.
600
N-2 for an independent samples test, but N-1 for a Paired Samples t-test
Degrees of Freedom
600
I'm comparing the attitudes of people in group B by gender, and get this test result:
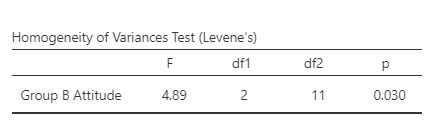
What should I click next?
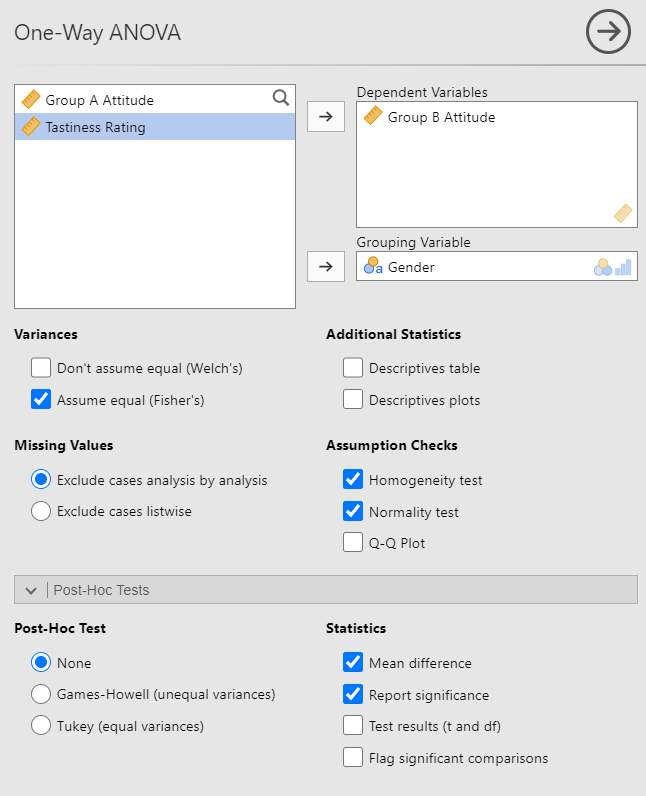
Welch's ANOVA and Games-Howell Post-hoc test
700
An assumption test that must be used in an independent samples t-test but not in a paired samples t-test
Levene's test of homogeneity of variances
700
A 95% CI for a mean difference between two groups on an independent samples t-test is [−1.2, 3.8]. Is the difference statistically significant and how do we know?
It is not statistically significant because the confidence interval contains zero.
700
For a paired t-test, the normality assumption applies to these scores specifically, rather than the raw scores.
the difference in scores between the two conditions (such as the difference in pre-post scores)
700
A one-way ANOVA comparing plant growth under three fertilizers (Brand A, Brand B, and Brand C was significant. The Tukey post hoc results were:
Brand A - Brand B: mean difference = 2.1, p = .214
Brand A - Brand C: mean difference = 5.8, p = .003
Brand B - Brand C: mean difference = 3.7, p = .048
The student concludes: Brand A and B weren't statistically signifiantly different, but Brand C resulted in higher plant growth than Brand A and Brand B.
Brand C resulted in lower plant growth than Brand A and Brand B.
700
The probability of correctly rejecting a false null hypothesis
Power/Statistical Power
700
The problem with how someone has input this data for an independent samples t-test:
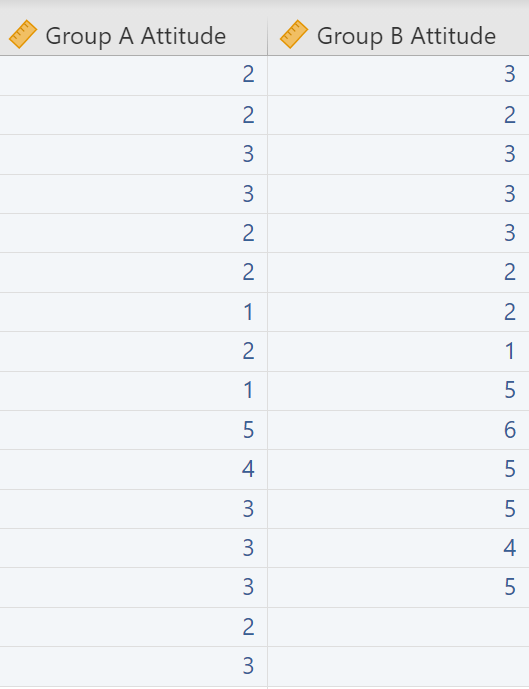
They should all be in the same column, with a separate categorical column for grouping variable.