Mean
Median
Mode/Range
Box Plots
Data Analysis
100
A class recorded the number of pages they read each day:
12, 15, 10, 18, 14, 11, 16, 13
→ What is the mean number of pages read?
Mean = 13.625
100
A class recorded the number of books read by students in a month:
3, 5, 2, 8, 6, 4, 7
→ What is the median number of books?
2, 3, 4, 5, 6, 7, 8 → Median = 5
100
A group recorded how many minutes they studied:
5, 10, 15, 20, 10, 25, 30, 10, 35
What is the range?
The range is 30
100
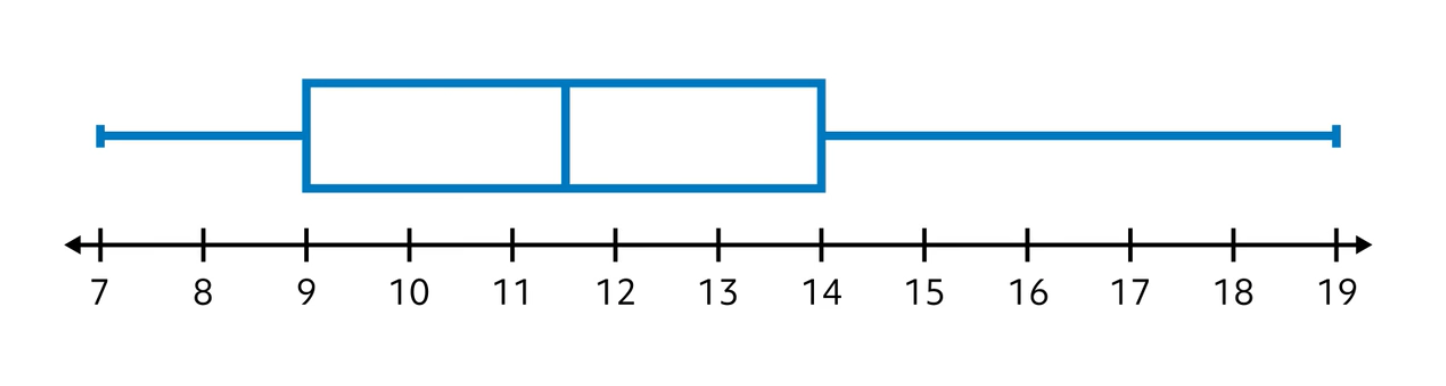 True or false? A quarter of the data is between 7 and 9
True
100
What does the IQR represent in a data set?
The middle 50% of the data
200
The daily temperatures (in °F) over several days were:
72, 75, 70, 68, 74, 71, 73
→ What is the mean temperature?
(round to the hundredths place)
Mean = 71.86
200
The number of minutes students spent on homework one night:
30, 45, 20, 50, 40, 35, 25, 60
→ What is the median time spent?
20, 25, 30, 35, 40, 45, 50, 60
→ Median = 37.5
200
A soccer team’s goals in games were:
1, 2, 3, 2, 4, 2, 5, 3
→ What is the mode AND the range?
Mode: 2
Range: 4
200
What is the IQR of this Box Plot?
IQR: 5
200
2, 1, 3, 2, 4, 2, 2, 5, 2
Which measure of center is best to use for this data set? Why?
Mode (2) because it takes up most of the data set
300
A basketball player scored these points in games:
8, 12, 10, 14, 6, 10, 9, 11, 13
→ What is the mean number of points scored?
(round to the hundredths place)
Mean = 10.33
300
A soccer team scored these goals in games:
1, 3, 2, 4, 2, 5, 3, 1, 2
→ What is the median number of goals?
1, 1, 2, 2, 2, 3, 3, 4, 5 → Median = 2
300
The temperatures (°F) over one week were:
68, 72, 70, 68, 75, 73, 68
What is the range?
The range is 7
300
What percent of the data is from 9 to 19?
75%
300
20, 25, 30, 15, 20, 21, 23, 31, 29
What measure of center would be best to use for this data set? Why?
Mean because the data is evenly spread and/or close together
400
The number of minutes a student spent practicing piano:
20, 25, 30, 15, 20
→ What is the mean practice time?
Mean = 22
400
The number of items sold at a bake sale each hour:
12, 15, 10, 18, 14, 11, 16, 13, 17, 19
→ What is the median number of items sold?
10, 11, 12, 13, 14, 15, 16, 17, 18, 19
→ Median = 14.5
400
The number of pages read by students:
14, 16, 20, 15, 25, 10, 30, 32
What is the mode?
No mode!
400
Create a 5 number summary with the following data set:
11, 13, 12, 10, 5, 14, 19, 17, 9
5, 9, 10, 11, 12, 13, 14, 17, 19
Min: 5
Max: 19
Median: 12
Q1: 9.5
Q3: 15.5
400
12, 15, 10, 51, 18, 14, 11, 16, 13
What measure of center would be best to use for this data set? Why?
Median because there is an outlier!
500
A gardener counted the number of flowers blooming in sections:
9, 12, 15, 6, 8, 10, 11, 7, 13, 14
→ What is the mean number of flowers?
Mean = 10.5
500
A group measured the heights (in inches) of plants:
8, 10, 7, 9, 12, 11, 6, 13, 14, 5, 15
→ What is the median height?
5, 6, 7, 8, 9, 10, 11, 12, 13, 14, 15 →
Median = 10
500
A class recorded the number of pets students have:
0, 2, 1, 3, 2, 4, 2, 1
What is the mode?
The mode is 2
500
What is the five number summary for this box plot?
Min: 7
Max: 19
Median: 11.5
Q1: 9
Q3: 14
500
In what case would it be better to use the median instead of the mean to represent the center of a data set?
When there is an outlier!