Definitions
Displaying Data
Measures of Central Tendency
Measures of Spread
Vocabulary
100
What kind of question has one correct, numbered response?
Numerical Question
100
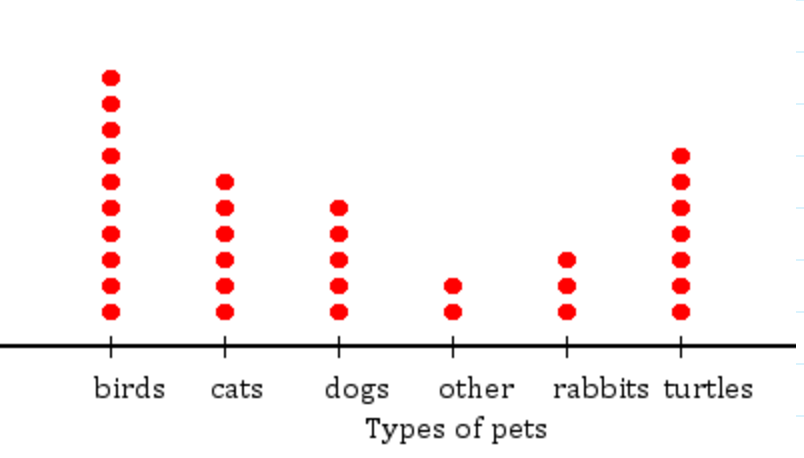 The dot plot shows the kinds of pets at a shelter. How many pets are at the shelter?
33
100
What are the three measures of central tendency?
mean, median, mode
100
What do measures of spread describe?
measures of spread describe how varied or scattered a dataset is around a central value
100
Define the following term:
Statistical Question
A question that yields multiple, varying responses
200
What kind of question is answered using verbal/linguistic responses?
Categorical question
200

According to the bar graph, what is the most common activity among babies at home?
Playing
200
Find the mode of the following data set:
1, 2, 1, 8, 1, 9, 34, 36, 1, 99, 100, 102, 1
1
200
What is the minimum value in the following dataset:
29, 30, 40, 60, 34, 17, 27, 102
17
200
Define the following term:
Median
The value at the center of an ordered data set.
300
What is the average of a dataset, determined by adding all the values together and dividing the sum by the total count of numbers?
Mean
300
According to the box and whisker plot, what is the median of the data?
80
300
Find the median of the following data set:
3, 6, 9, 3, 6, 9, 12, 14, 16
9
300
What is the maximum value in the following dataset:
29, 30, 40, 60, 34, 17, 27, 102
102
300
Define the following term:
Range
the difference between the lowest and highest values in a data set, representing the spread of data
400
What term describes the value that repeats the most in a data set?
Mode
400
Display the following data as a histogram:
20, 22, 33, 34, 35, 44, 46, 47, 48, 51, 55, 57, 58, 59
*Histogram with 4 buckets of data:
20-30: 2
30-40: 3
40-50: 4
50-60: 5
400
Find the mean of the following data set:
0, 5, 10, 12, 20, 22, 23, 25, 30, 30, 32, 35
20 1/3
400
What is the range of the following dataset:
29, 30, 40, 60, 34, 17, 27, 102
85
400
Define the following term:
Outlier
an extreme value, either much smaller or much larger than others in the dataset
500
What term describes the tendency of data points to differ, change, or spread out rather than remain uniform?
Variability
500
According to the box and whisker plot, what is the interquartile range of the data?
9
500
Find the Mean Absolute Deviation of the following data set:
2, 4, 6
1 1/3
500
What is the interquartile range of the following data set:
29, 30, 40, 60, 34, 17, 27, 102
22
500
Define the following term:
Interquartile Range
a measure of statistical dispersion that represents the spread of the middle 50% of a dataset. Calculated as the difference between the third quartile (Q3) and the first quartile (Q1), the IQR (IQR = Q3 - Q1) identifies where the bulk of values lie, often used to detect outliers