Vocabulary
Measures of Center
Measures of Variability
Misc Stats
General Knowledge
100
The midpoint of a distribution.
What is the median?
100
The median of these numbers:
82, 93, 77, 79, 90, 82, 85, 85, 95, 73, 79, 83, 89
What is 83?
100
The percent of the distribution is from Q1 to Q3
What is 50%?
100
The values included in a 5-number summary
What are minimum, Q1, median, Q3, and maximum?
100
The name of the hero in The Legend of Zelda
Who is Link?
200
The average of all the data values.
What is the mean?
200
The mean of these numbers:
82, 93, 77, 79, 90, 82, 85, 85, 95, 73, 79, 83, 89, 0
What is 78?
200
The IQR of these numbers:
14, 7, 6, 5, 12, 38, 8, 7, 10, 10, 10, 11, 4, 5, 22, 7, 5, 10, 35, 7
What is 5?
200
The outliers for the following data:
1.1, 1.3, 1.3, 1.6, 1.9, 1.9, 2.1, 2.2, 2.4, 2.5, 2.7, 3.0, 4.4, 4.7, 5.0, 5.6, 6.2, 7.5
Q1 = 1.9
Q3 = 4.7
What is there are no outliers?
200
This member of the Avengers had a brief stint as a pop star
Who is Brie Larson?
300
The typical distance of each value from the mean.
What is the standard deviation?
300
The measure of center we use for this distribution: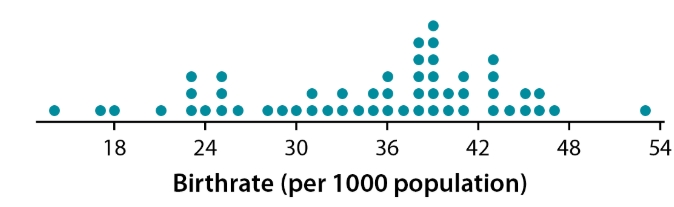
What is the median?
300
The measure of variability we use for this distribution:
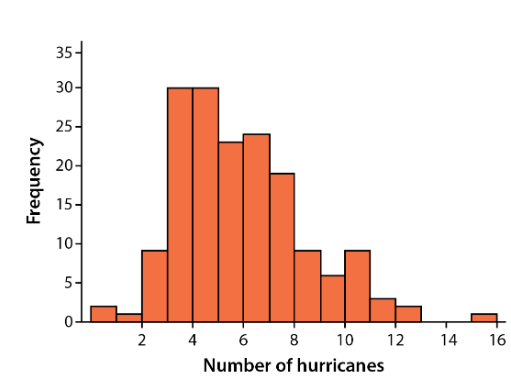
What is the IQR?
300
The shape of this distribution: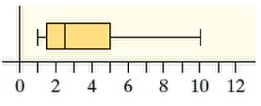
What is skewed right?
300
The capital of Kenya.
What is Nairobi
400
The distance between the first and third quartiles.
What is the interquartile range (IQR)?
400
Why do we use the median as a measure of center when the distribution is skewed or has outliers?
Because it is resistant
400
The first 10 students to arrive for a first-period statistics class were asked how much sleep (to the nearest hour) they got last night. The standard deviation is 0.52 hours.
Interpret the standard deviation
The number of hours of sleep of the students typically varies from the mean by about 0.52 hours.
400
Describe the following distribution: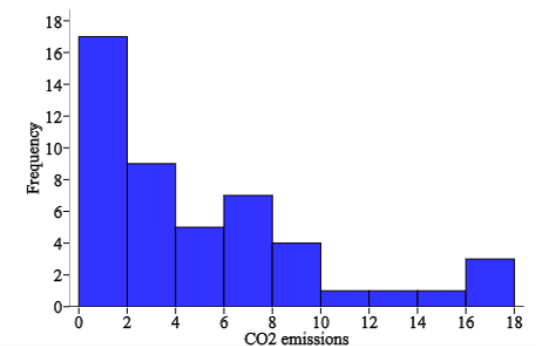
Shape - skewed right with a peak between 0 and 2
Outliers - no potential outliers
Variability - Varies from at least 0 to at most less than 18.
400
The amount of dimples that an average golf ball has
What is between 300-500?
500
If something is not influenced much by extreme values.
What is resistance/resistant values?
500
Where the mean lies in relation to the median in a distribution that is skewed left.
What is to the left of the median?
500
The standard deviation of these numbers:
7, 7, 8, 10
What is 1.41?
500
The following boxplots summarize data on the travel times to work for 20 randomly chosen New Yorkers and 15 randomly chosen North Carolinians.
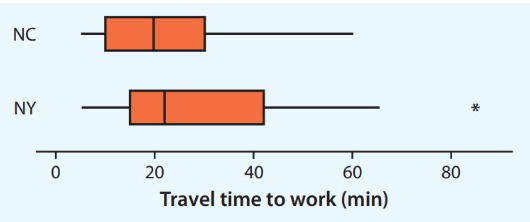
Compare the distributions of travel time for the workers in these two states.
Both distributions are skewed to the right
There is one outlier in the travel times for New Yorkers at about 85 minutes. There are no outliers in the travel times for North Carolinians.
The typical travel time for New Yorkers (median ≈ 22 minutes) is slightly greater than the typical travel time for North Carolinians (median ≈ 20 minutes).
There is more variation in travel times for New Yorkers (IQR ≈ 27 minutes) than for North Carolinians (IQR ≈ 20 minutes).
500
Before people made Jack-o'-lanterns for Halloween, they would carve faces into this vegetable.
What are turnips?