Map It Out
Maps Lie!
Think Spatially/Data and Tech
Human-Environment Interaction
Scale of Analysis
100
A map uses different shades for each county to display the percentage of residents living below the poverty line. Identify the type of thematic map.
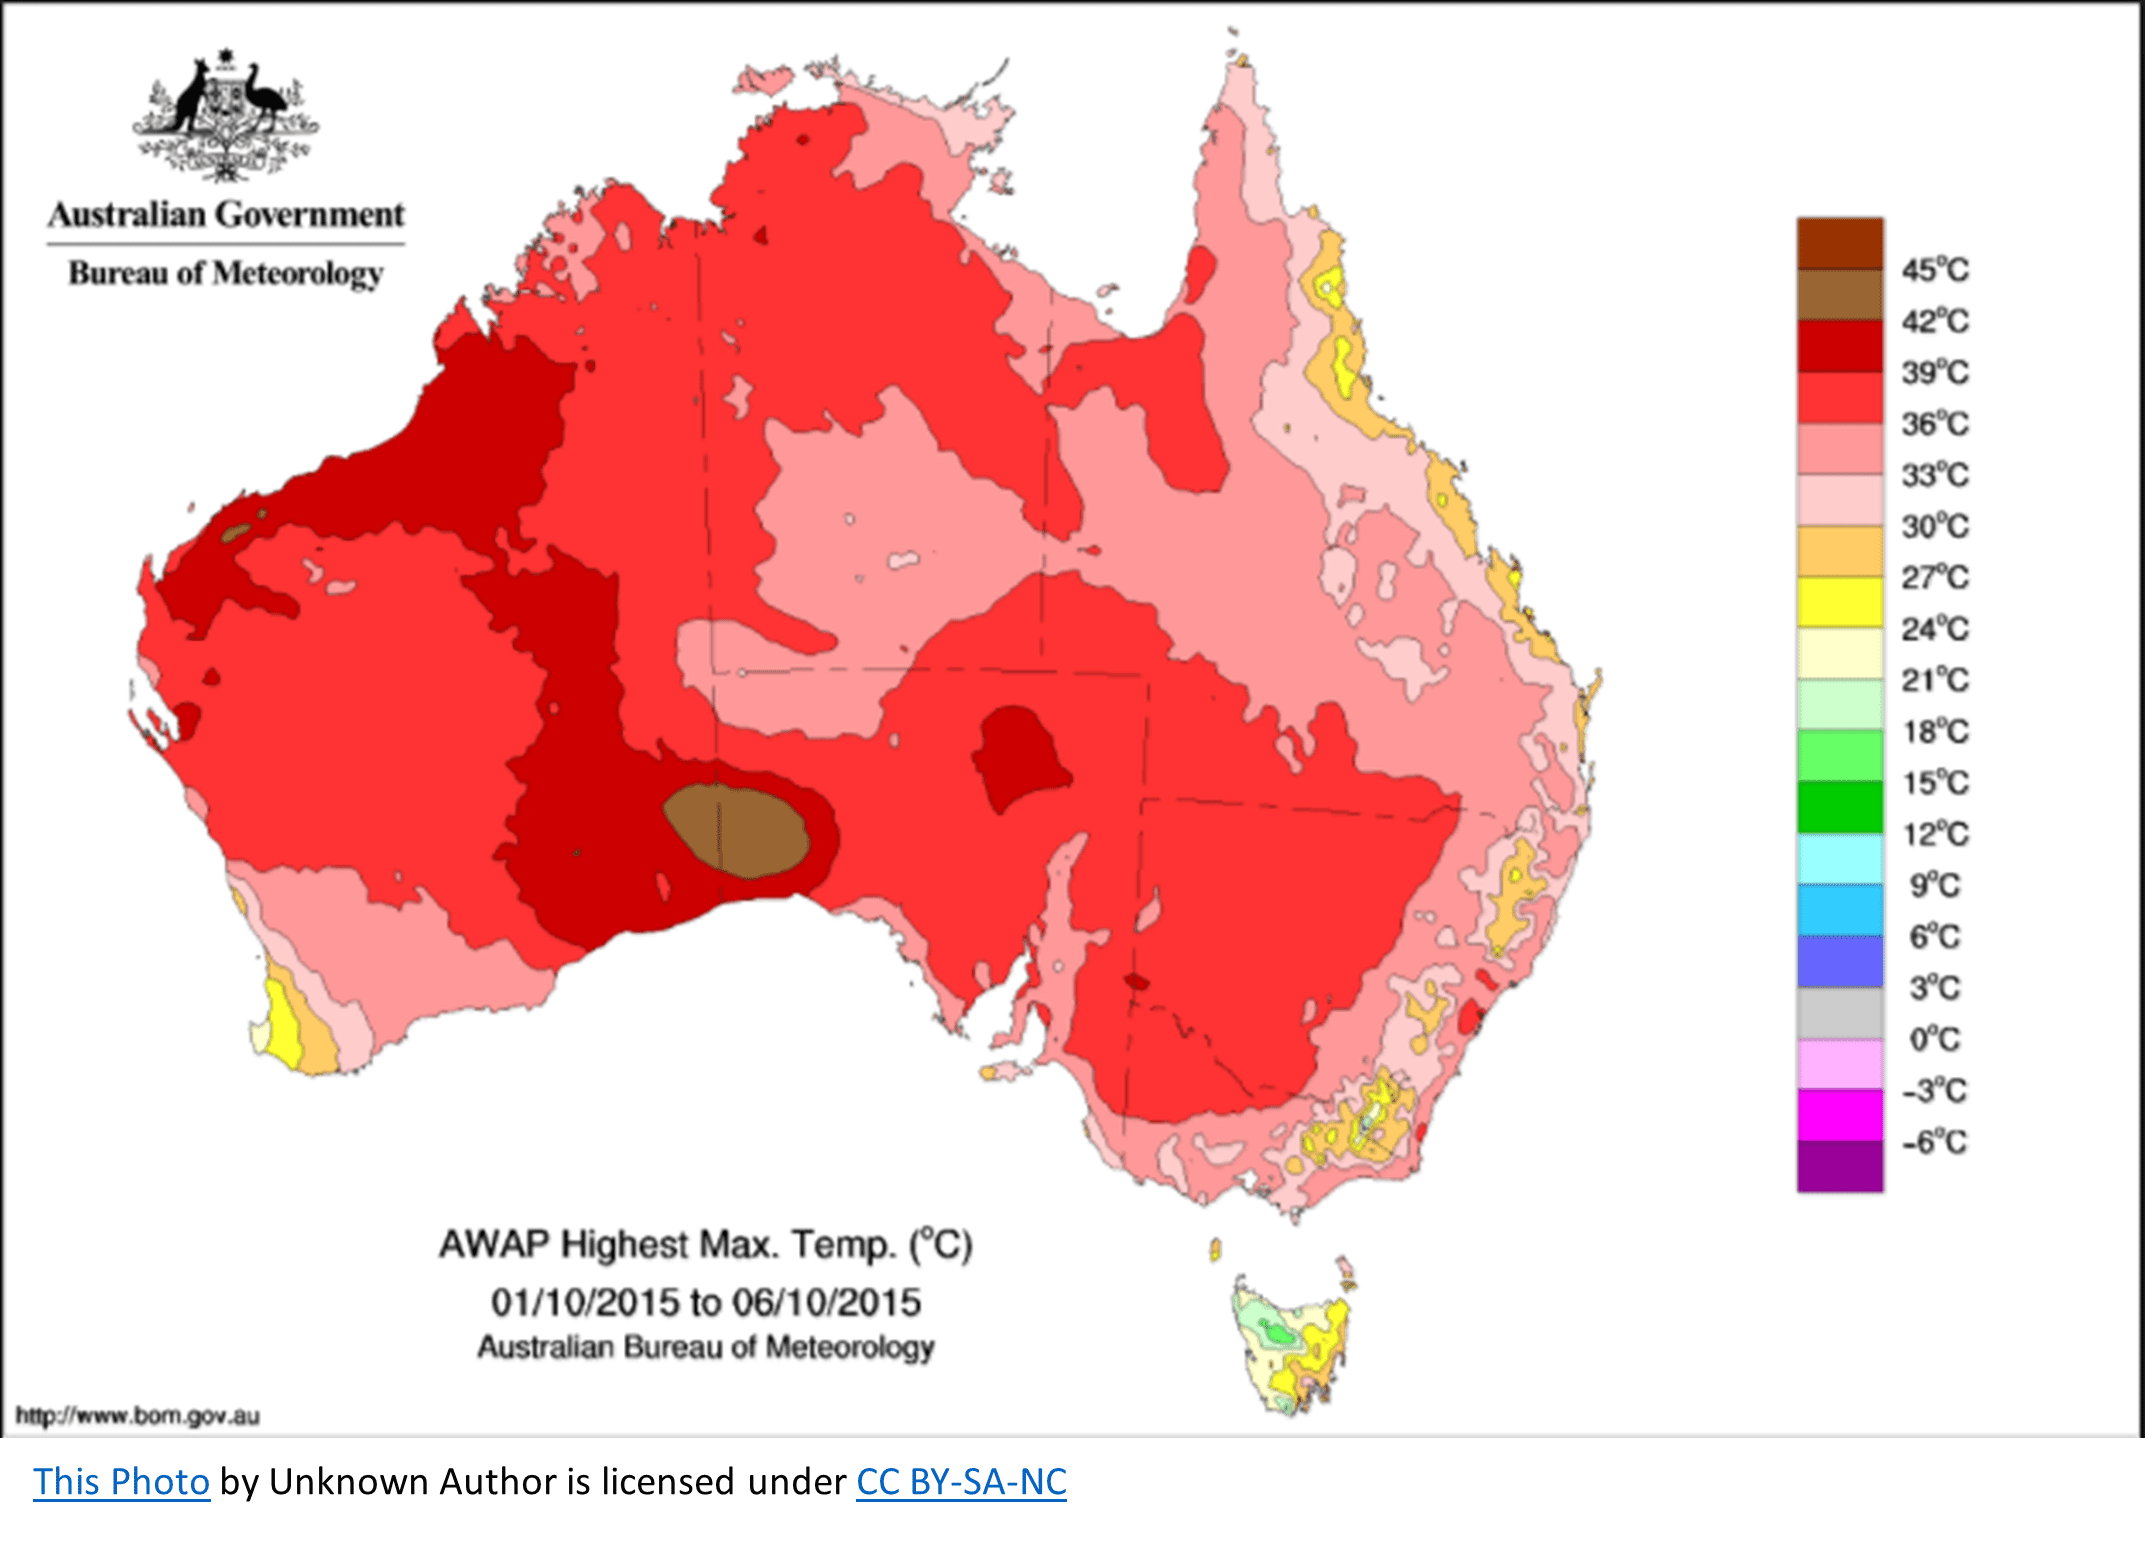 choropleth map
100
One student describes Miami as 25.76° N, 80.19° W, while another describes it as south of Fort Lauderdale and east of the Everglades. Identify the two types of location being used.
What are absolute location and relative location?
100
This technology uses satellites to determine a person's exact location on Earth.
What is GPS?
100
A coastal community cannot construct traditional basements because its water table is extremely high. This argument most strongly reflects which perspective?
What is environmental determinism?
This theory argues that the physical environment strongly shapes or determines human behavior and societal development.
100
Florida's official state boundaries make it this type of region.
What is a formal political region?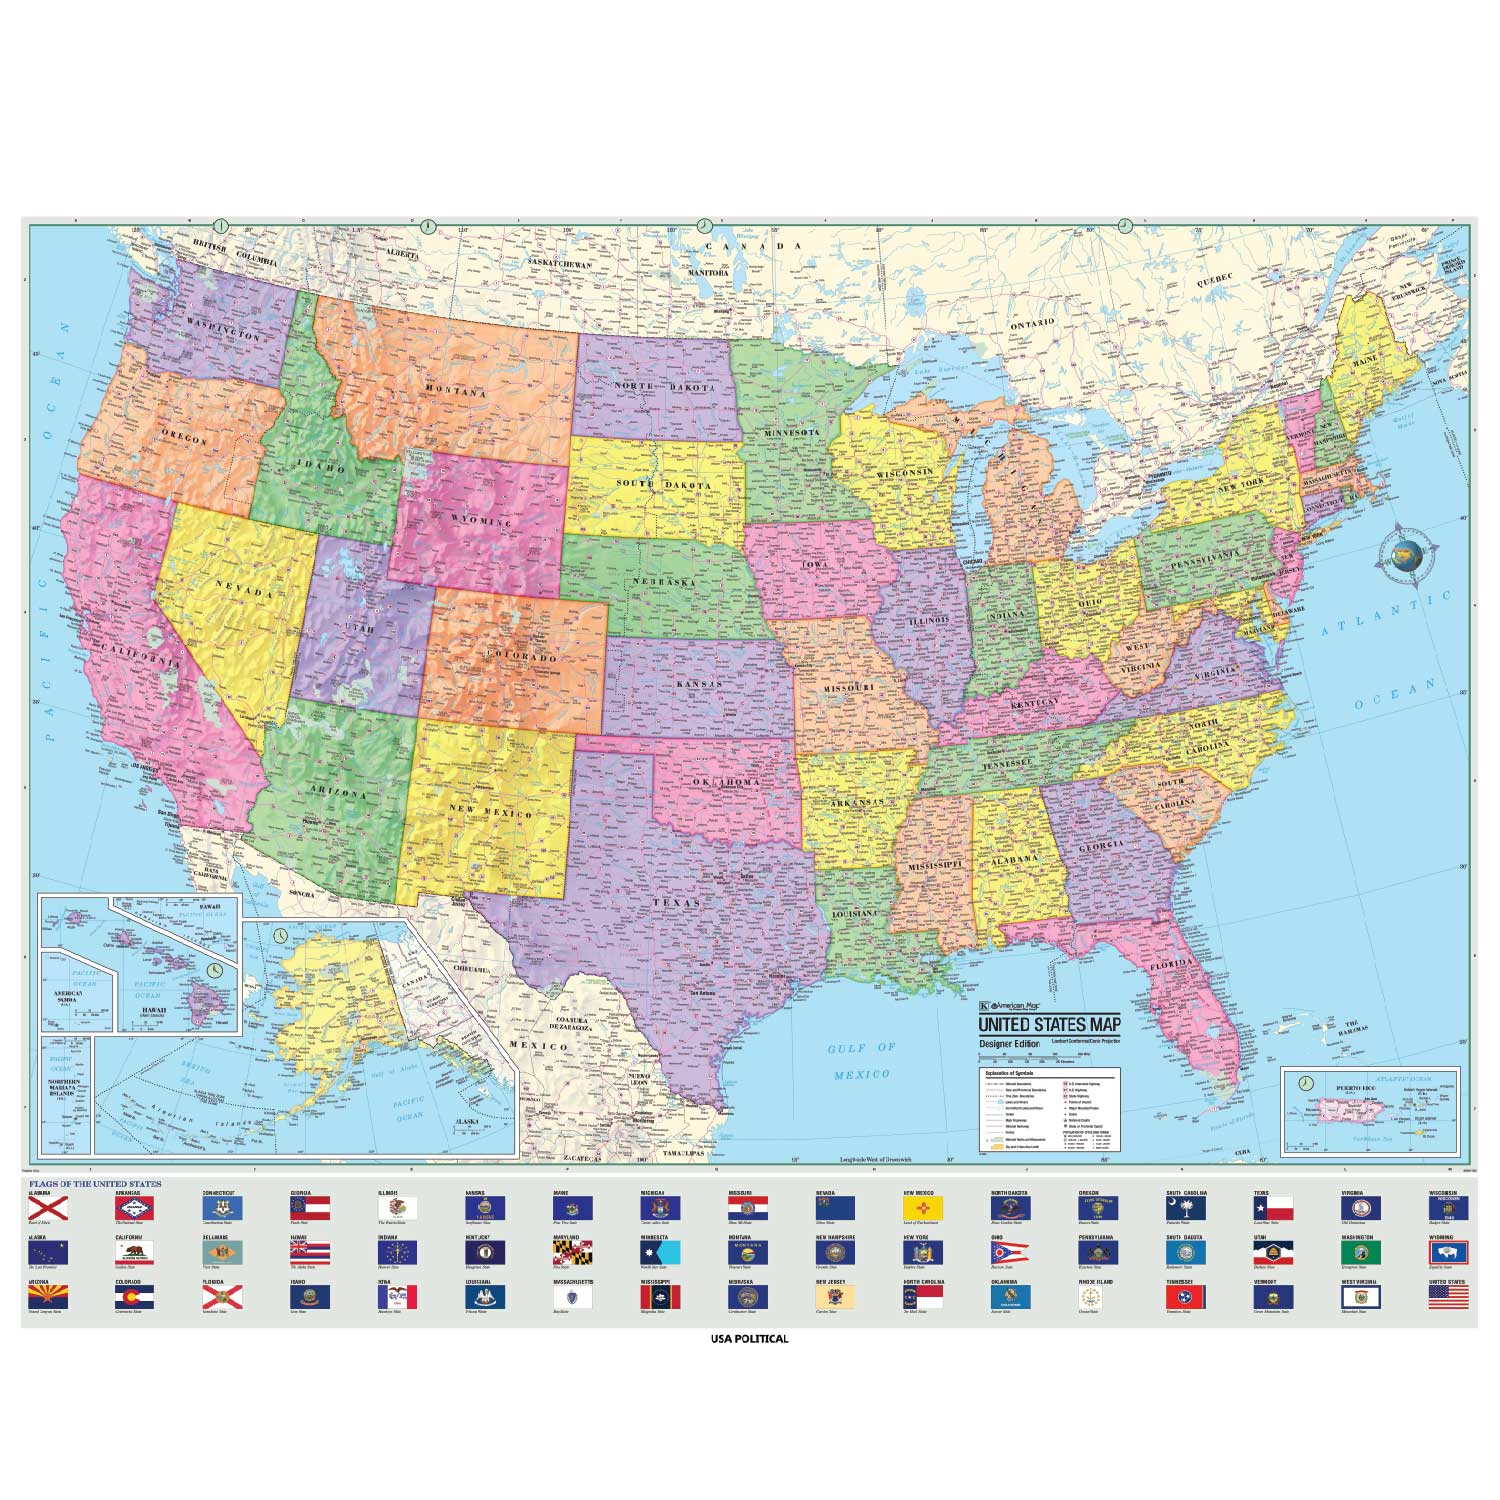
200
A map places circles over cities, with larger circles representing larger populations. Identify the type of thematic map.
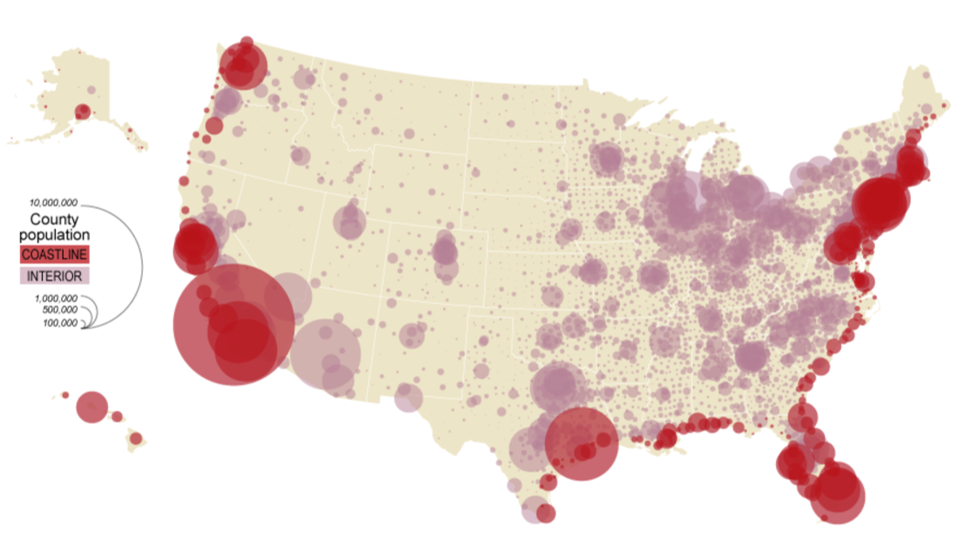 graduated/proportional symbol map
200
This projection preserves direction well enough to make it historically useful for navigation but greatly exaggerates the size of land near the poles.
Mercator projection
200
Satellites capture images of changes in the Amazon rainforest without researchers physically visiting the area. Identify the geographic technology being used.
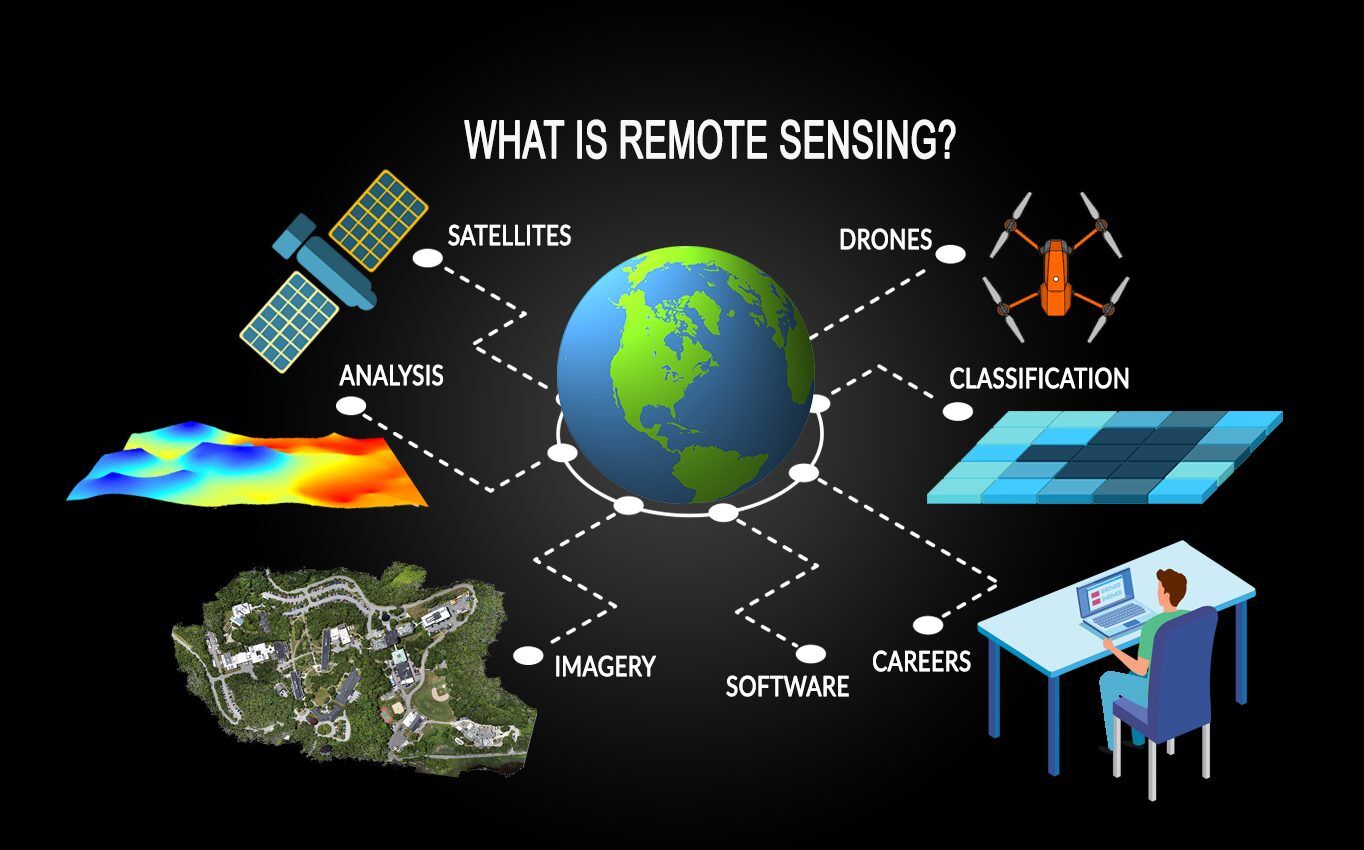
What is remote sensing?
200
Despite having large areas below sea level, the Netherlands uses dikes, canals, pumps, and polders to maintain settlements and farmland. Which geographic perspective does this illustrate?
What is possibilism?
This theory argues that the environment creates limitations, but humans can use culture and technology to adapt to those limitations.
200
“The South” has no official boundary, and people may disagree about which states belong to it. Identify this type of region and explain why its boundaries can vary.
What is a perceptual/vernacular region? Its boundaries are based on people’s ideas and perceptions of an area rather than official boundaries.
300
A weather map connects locations experiencing the same atmospheric pressure. Identify the type of map being used.
isoline map
300
A cartographer wants a world map for a classroom wall that avoids the extreme size distortion of Mercator but accepts that no property will be perfectly preserved. Which projection would be an appropriate choice?
 Robinson projection
300
A shopping district has restaurants concentrated in one area, while nearby towns are arranged one after another along a major highway. Identify the two spatial distribution patterns shown.
What are clustered/agglomerated distribution and linear distribution?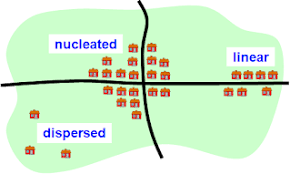
300
According to environmental determinism, which environment would historically be considered most favorable for the development of large, productive settlements?
A. Extremely cold polar climates
B. Mild climates with moderate temperatures
C. Extremely dry desert climates
D. High mountainous environments
What is B, mild/temperate climates?
300
The area served by one airport, television station, or shopping mall is organized around a central node and is therefore this type of region.
What is a functional (nodal) region?
400
A geographer wants to show the precise distribution of cattle across Texas rather than the percentage of cattle located within each county. Which thematic map would be most appropriate?
 dot distribution map
400
A shipping company wants sailors to easily follow compass bearings across an ocean. Between Mercator and Gall-Peters, which projection would be more useful, and why?
What is Mercator, because it preserves direction better and was designed for navigation
400
Advances in air travel and the internet allow people, goods, and information to move between distant places much faster than in the past. This process makes distant locations seem closer together.
What is time-space compression?
400
A rapidly growing city is replacing natural areas with new housing developments. The city requires developers to preserve wetlands, use water-efficient landscaping, and limit construction in environmentally sensitive areas. Identify the geographic concept demonstrated by these policies.
What is sustainability?
400
A county-level map shows relatively little variation in household income, while a map of the same county divided into census tracts reveals several clusters of high and low income. Identify what a census tract is AND explain why the census-tract map reveals a different spatial pattern.
A census tract is a small geographic area used to collect and organize census data. Using census tracts provides a more detailed scale of analysis, revealing local variations that may be hidden when data are aggregated at the county level.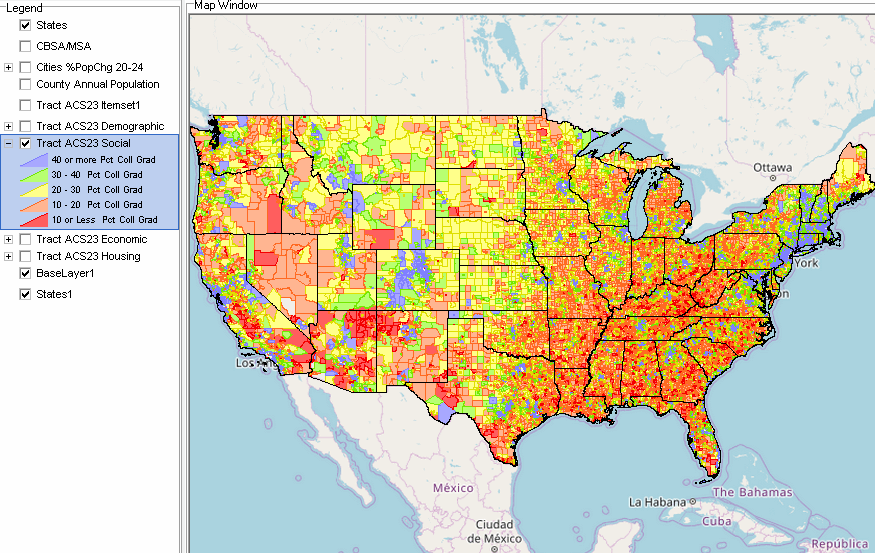
500
Two counties have the same number of people, but one is geographically much larger. A mapmaker enlarges or shrinks each county based on population rather than its actual land area. Identify the type of map.
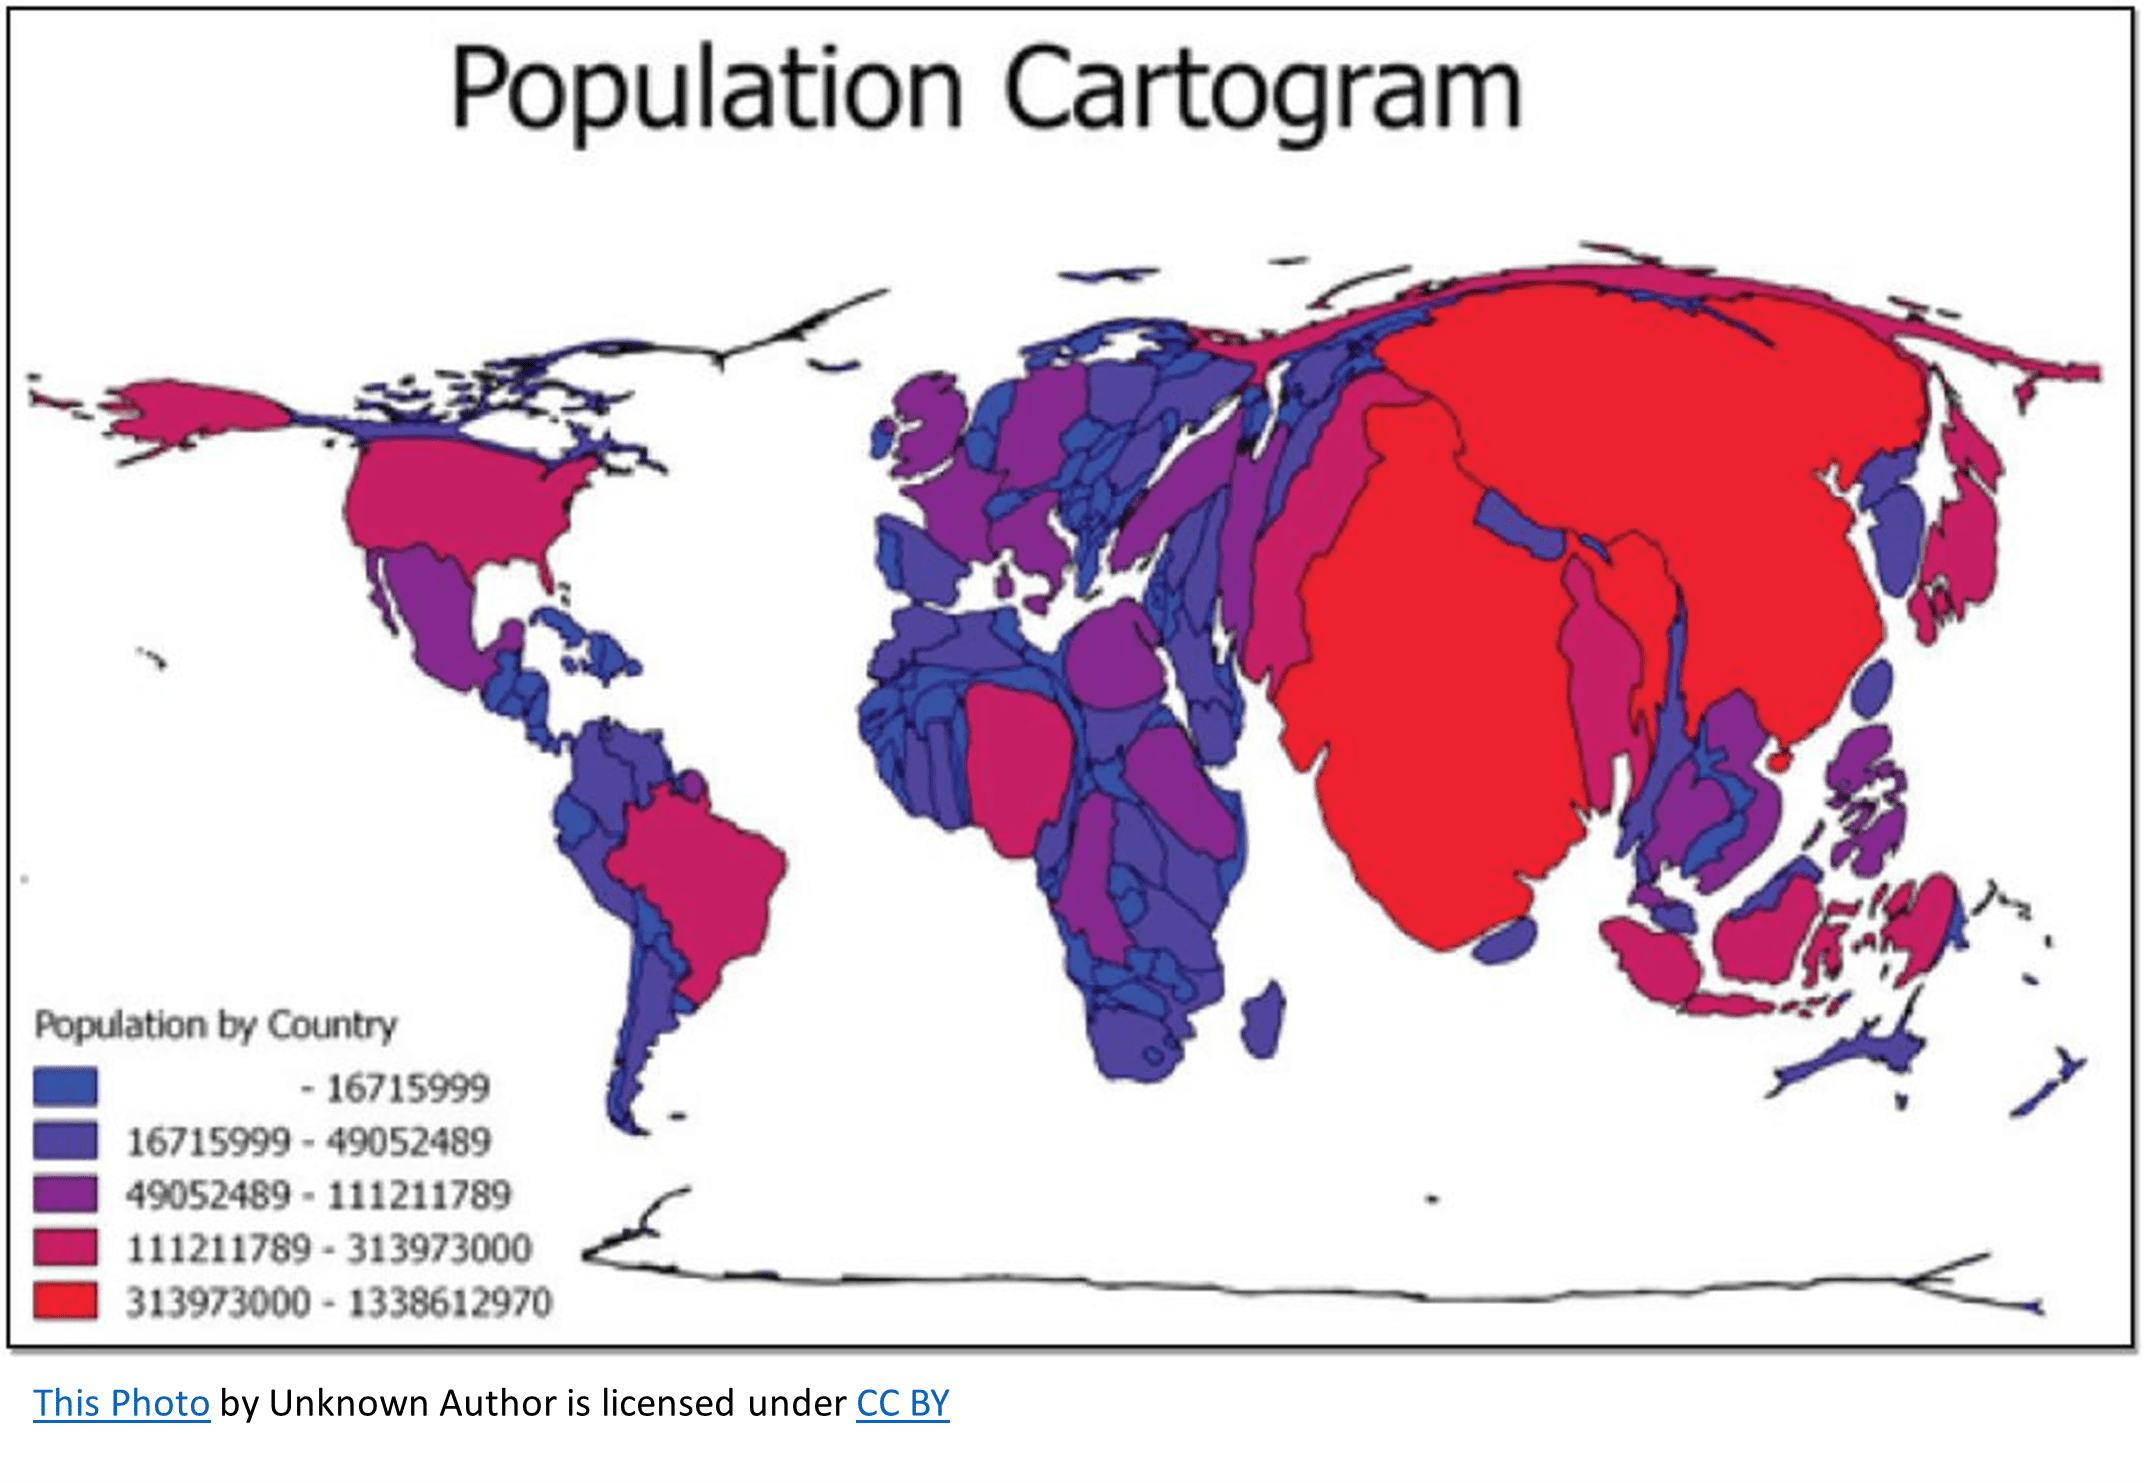 cartogram
500
Latitude and longitude create a global coordinate system. Identify what latitude measures and its reference line, AND identify what longitude measures and its reference line.
Latitude measures distance north or south of the Equator, while longitude measures distance east or west of the Prime Meridian.
500
A city maps population data by ZIP code and overlays it with roads, flood zones, and hospital locations to determine the best location for a new emergency shelter. Identify the geographic technology that allows the city to combine and analyze these layers of spatial data.
What is GIS?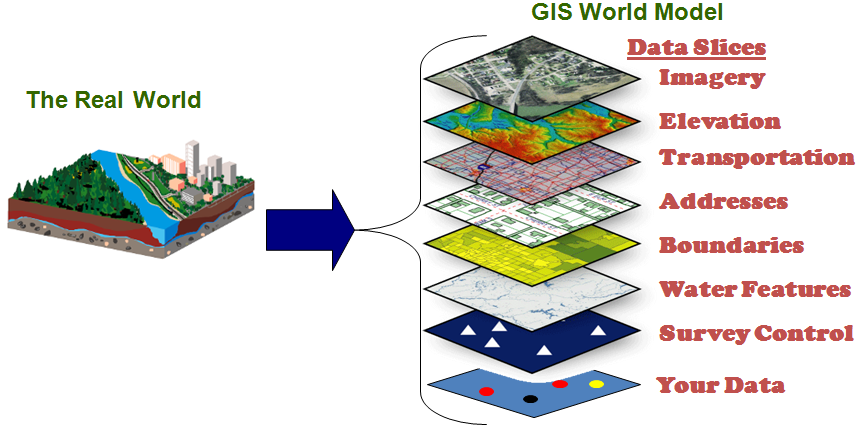
500
A coastal country faces frequent flooding. Some communities relocate away from flood-prone areas, while others construct seawalls, drainage systems, and elevated buildings to remain in place. Explain how these two responses demonstrate different ways humans interact with the environment.
Relocating demonstrates how the environment can constrain human activity, while constructing infrastructure demonstrates possibilism, humans using technology to adapt to or modify environmental limitations.
500
A national map shows a relatively low poverty rate for an entire state. When the same data are mapped by census tract, several concentrations of high poverty appear. Explain why both maps can be accurate despite showing different spatial patterns.
What is data are aggregated differently at different scales of analysis, which can reveal or conceal local variation?