Frequency Tables
Association
Linear Models
Line of Best Fit
100
A survey was conducted to find out whether students preferred basketball or football. The results, organized by gender, are summarized in the table below.
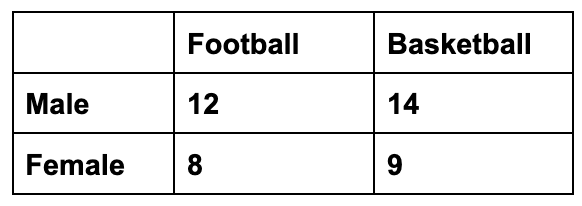
How many female students preferred basketball?
9
100
Look at the row relative frequency table above comparing grade level and pet preference.

Based on the table, is there an association between grade level and pet preference?
No; because the relative frequencies are identical (60% and 40%) for both groups.
100
A scatter plot shows the relationship between the number of pages in a book and the time in minutes it takes a student to read it. There is a data point plotted at (120, 180).
What does the coordinate point (120, 180) mean in this situation?
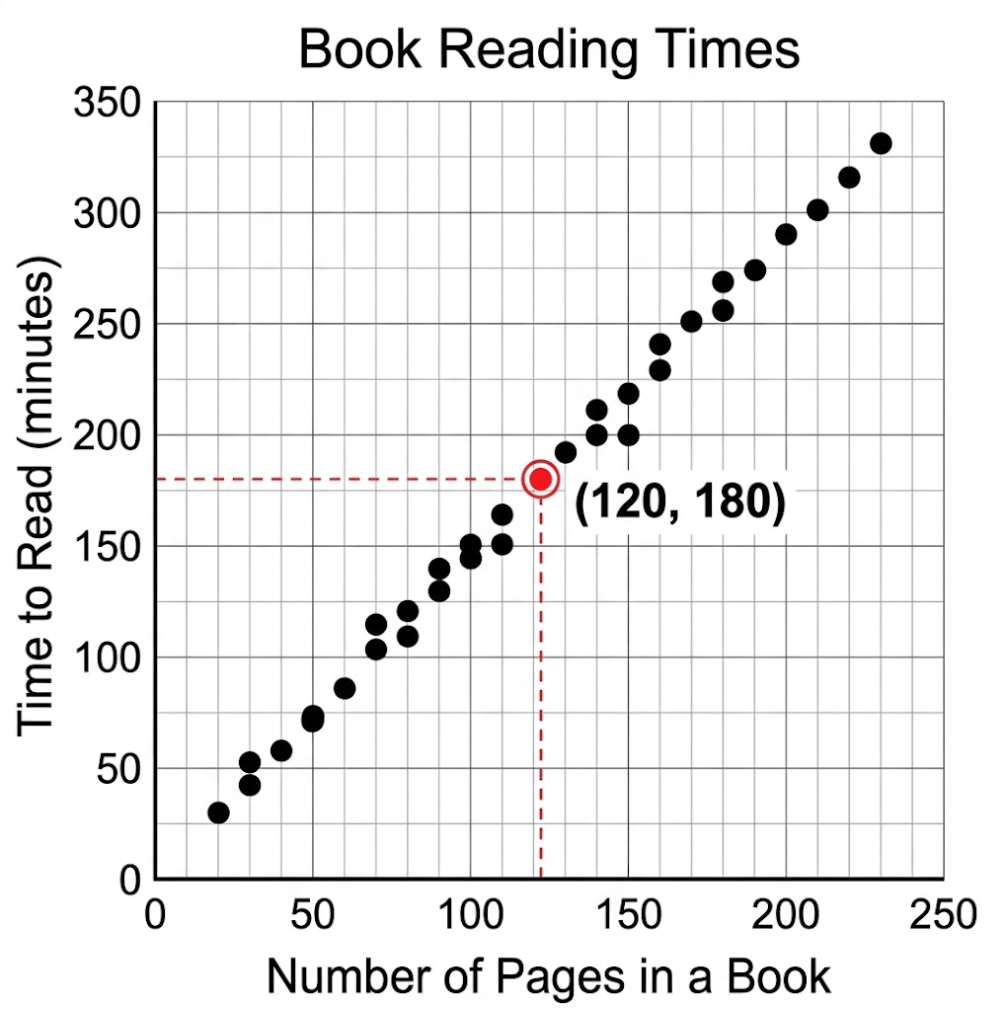
A 120-page book took 180 minutes to read.
100
A linear regression equation is given in the form y = ax + b to represent final exam scores based on hours studied. What do the variables a and b represent in this equation?
A) a represents the y-intercept, and b represents the slope.
B) a represents the slope, and b represents the y-intercept.
C) a represents the x-intercept, and b represents the slope.
D) a represents the correlation coefficient, and b represents the predicted score.
B) a represents the slope, and b represents the y-intercept.
200
A survey was conducted to find out whether students preferred basketball or football. The results, organized by gender, are summarized in the table below.
How many students are male?
26
200
Look at the row relative frequency table below.

Based on the data, is there a possible association between age group (teens vs. adults) and coffee preference?
Yes, because the relative frequencies are very different (20% vs. 75% for coffee preference), showing that knowing the age group helps predict coffee preference.
200
A student tracks their earnings based on the number of lawn orders completed. The line of best fit for the data is:
y = 12.50x + 5.00
where x represents the number of lawns mowed and y represents total pay in dollars.
Using the equation, predict the total pay for mowing 8 lawns.
$105.00
200
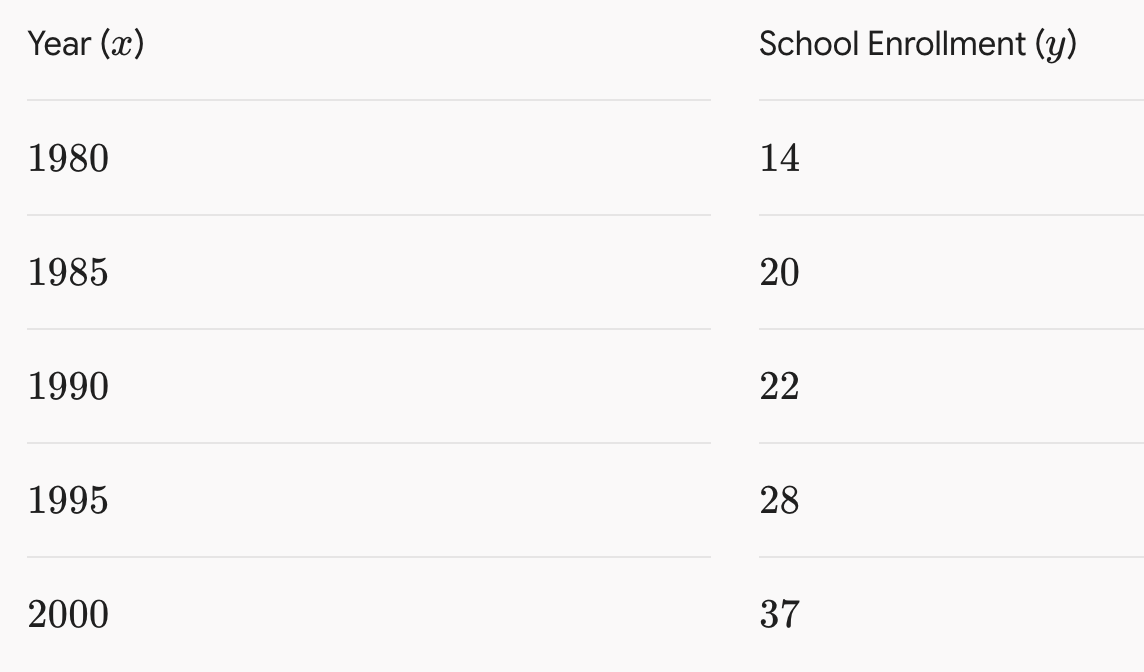
Which linear regression equation best models the school enrollment data rounded to the nearest hundredth?
A) y = 1.08x - 2125.00
B) y = -2125.00x + 1.08
C) y = 1.08x + 2125.00
D) y = 0.98x - 2125.00
A) y = 1.08x - 2125.00
300
A survey was conducted to find out whether students preferred basketball or football. The results, organized by gender, are summarized in the table below.
Among the students surveyed, what percentage of them are male? Round to the nearest percent.
60%
300
Convert the rows into row relative frequencies for passing the test.

Based on your calculated percentages, is there an association between homework completion and passing the test?
Yes, there is a strong association because 85% of students who completed homework passed, compared to only 40% of those who did not.
Row Relative Frequencies:
Completed Homework: 85% passed (34/40 = 0.85), 15% failed
Did Not Complete Homework: 40% passed (12/30 = 0.40), 60% failed
300
A study tracks the temperature drop as elevation increases. The linear model is given by:
y = -3.5x + 72
where x represents elevation in thousands of feet and y represents temperature in degrees Fahrenheit.
What does the slope value of -3.5 mean in this situation?
For every additional 1,000 feet in elevation, the temperature decreases by 3.5 degrees Fahrenheit.
300
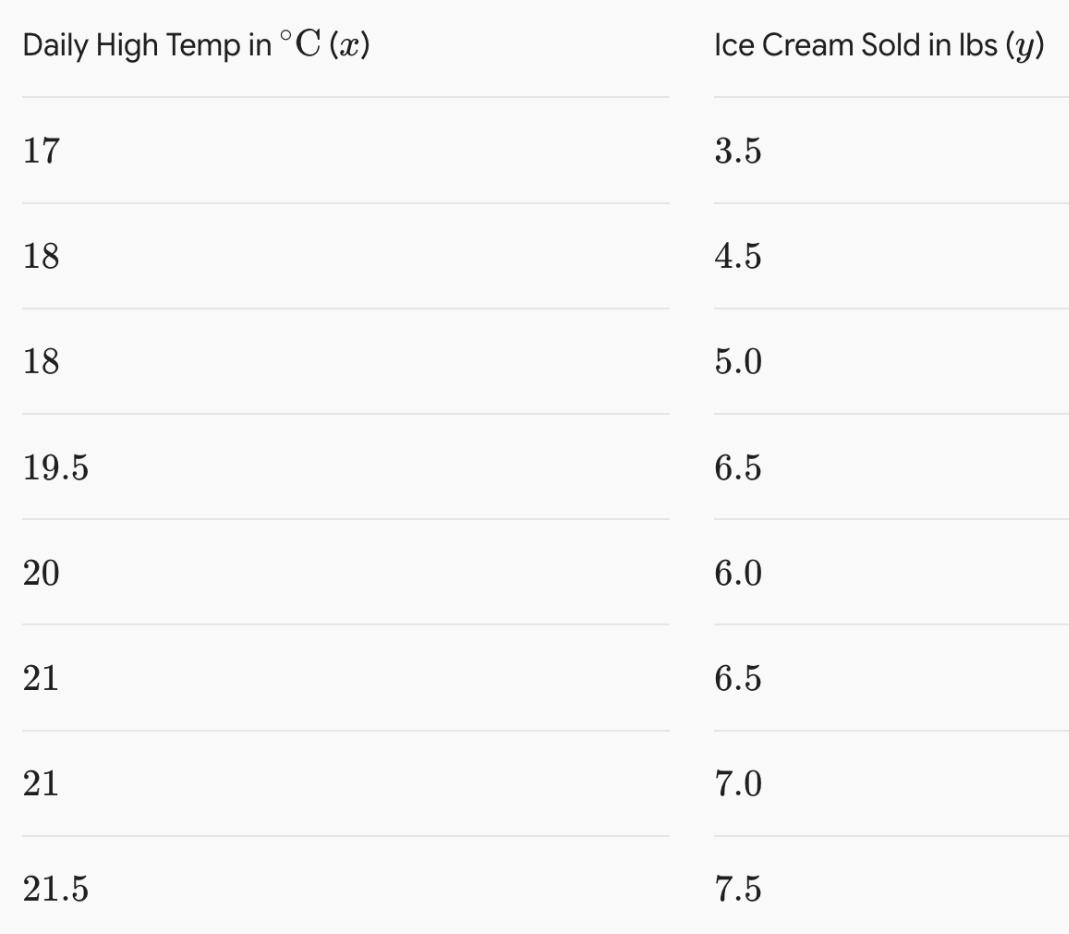
Which linear regression equation best models the ice cream sales data rounded to the nearest hundredth?
A) y = 0.78x - 9.44
B) y = -9.44x + 0.78
C) y = 0.78x + 9.44
D) y = 0.92x - 9.44
A) y = 0.78x - 9.44
400
A survey was conducted to find out whether students preferred basketball or football. The results, organized by gender, are summarized in the table below.
Among the female students surveyed, what percentage of them preferred football? Round to the nearest percent.
47%
400
Using column relative frequencies, calculate the percentage of sneaker-wearers in Classroom A and the percentage of non-sneaker-wearers in Classroom A. Does the difference across columns indicate a meaningful association?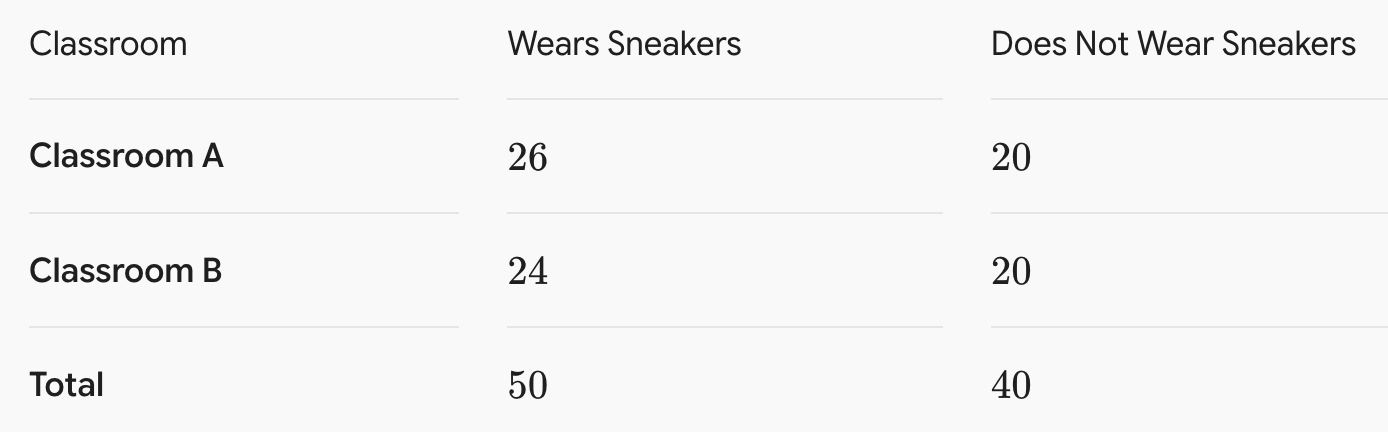
No, the difference between 52% and 50% is too small (2%).
Column Relative Frequencies:
Wears Sneakers: 52% Classroom A (26/50)
Does Not Wear Sneakers: 50% Classroom A (20/40)
400
A taxi ride cost is modeled by the linear equation:
y = 2.75x + 3.50
where x is the distance traveled in miles and y is the total fare in dollars.
What does the y-intercept of this equation represent in this context?
It represents the base/initial fare of $3.50 before traveling any miles.
400
A teacher runs a linear regression comparing homework grades (x) to subsequent test grades (y). The regression equation generated is
y = 0.83x + 12.15.
What does the b value (12.15) represent in the context of this situation?
A) The expected test grade for a student who scored 0 on their homework.
B) The increase in test grade for every 1-point increase in homework grade.
C) The homework grade earned by a student who scored 0 on the test.
D) The maximum possible score a student can earn on the test.
A) The expected test grade for a student who scored 0 on their homework.
500
A survey was conducted to find out whether students preferred basketball or football. The results, organized by gender, are summarized in the table below.
Among the students who preferred basketball, what percentage were male? Round your answer to the nearest percent.
61%
500
Calculate the column relative frequency of 9th graders among bus-riders and among non-bus-riders. Is there an association between grade level and transportation choice?
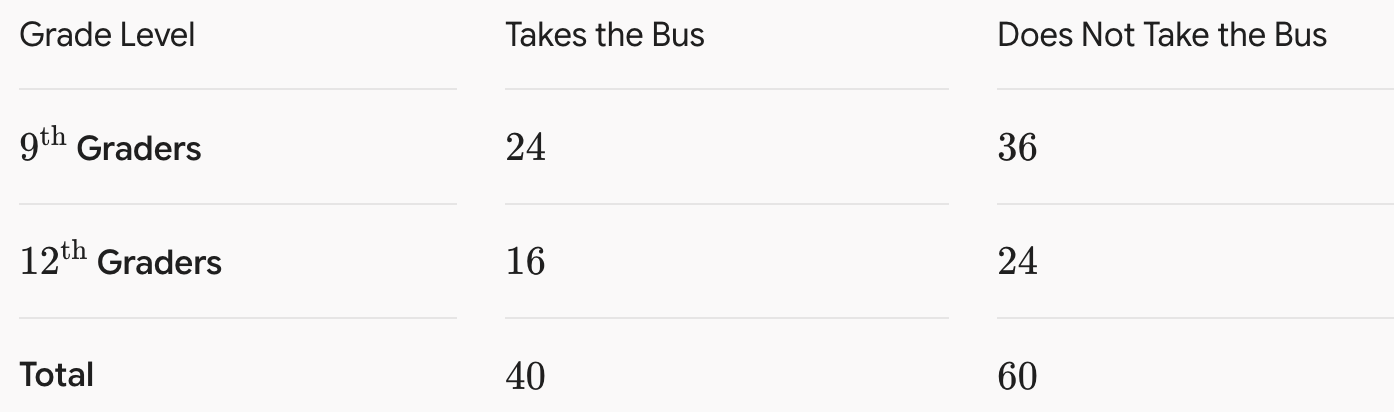
No, there is no association because 9th graders make up 60% of both categories.
- 9th Graders who take the bus: 60% (24/40 = 0.60)
- 9th Graders who do not take the bus: 60% (36/60 = 0.60)
500
A line modeling battery life on a smartphone is given by:
y = -8.5x + 100
where x represents hours of video streaming and y represents battery percentage remaining.
Is a y-intercept of (0, 100) realistic in this real-world scenario?
Yes, it is realistic. When 0 hours of video have been streamed (x = 0), the phone starts at a full charge of 100\% (y = 100).
500
The statewide average gas price since the year 2000
(x = years since 2000) is modeled by the linear regression equation y = 0.08x + 1.26, where y is the price per gallon.
If the actual gas price in the year 2005 was $2.96 per gallon, how much higher was the actual price than the predicted price?
A) $1.66 per gallon
B) $1.30 per gallon
C) $0.08 per gallon
D) $2.96 per gallon
B) $1.30 per gallon