Waves
Electromagnetic Waves
Types of Energy &
Energy Tranfers
Energy Tranfers
Newton's Laws
Motion Diagrams &
Graphs
Graphs
100
The distance between a crest and the next crest of a wave
Wavelength
100
EM waves do not need a medium to travel through.
True
100
Category of energy stored in a substance
Potential
100
F = ma
Newton's Second Law
100
Graph best used to present percentage of a whole.
Pie Chart
200
Height of a wave from the center/middle of a wave
Amplitude
200
3 * 10^8 m/s
Speed of light
200
The form of Kinetic Energy transmitted by a longitudinal/compression wave.
Sound
200
The tendency of an object to resist changes in it's movement - whether the object is moving or not.
Inertia
200
The bottom box here.
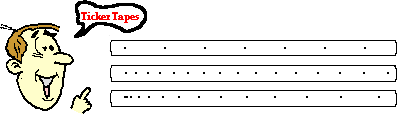
Motion diagram of acceleration
300
c = f * l (Lambda)
formula for the speed of a wave
300
Light is produced when this subatomic particle moves/jumps DOWN energy shells
Electron
300
The 4 forms of Potential energy
Elastic, Nuclear, Chemical, Gravitational
300
When a book is stationary on a table, gravity pulls the book down with an equal force as the table pushes up.
Example of Newton's 3rd Law
300
Graph used to demonstrate CO2 (ppm) in the atmosphere over time.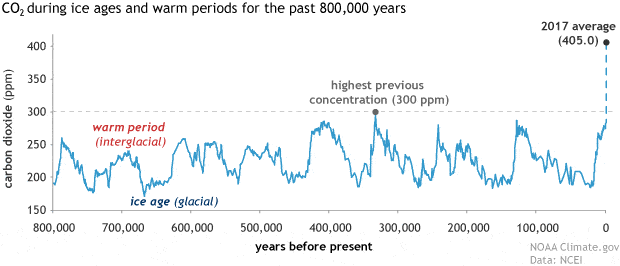
Scatter plot with connected line.
400
Find the speed of the wave:
Wavelength = 1.1 x 10^-5m
Frequency = 9 Hz
9.9 x 10^-5
400
Increases as wavelength decreases.
Energy and frequency
400
Place where Kinetic energy is equal to Potential energy for the skater on the ramp.

What is half way down the ramp.
400
An equal force on two different objects produces two different accelerations, so there must be a difference in this attribute of the objects.
Mass
400
This motion diagram:
x x x x x x x x x x x x x x x x
Accelerating, decelerating, accelerating again
(e.g. a ball being thrown up in the air)
500
Find the Wavelength of the wave:
Speed = 3.5 x 10^4 m/s
Frequency = 5Hz
7 x 10^3 m
500
Color of visible light with the lowest energy.
Red
500
In energy transfer, some energy is usually 'lost'/transferred in this form
Thermal (or Sound)
500
The principle that the earth pulls the moon toward it quite quickly but the moon pulls the earth toward it very very slightly.
Newton's 3rd Law - Equal and opposite forces
&
Newton's 2nd - the moon has much less mass than the earth.
500
The type of graph that would best display the data for how increasing the mass of a car affects its acceleration
Scatterplot with a line of best fit