Circle Graphs
Balance Point
Measures of Center
Bar vs Circle
Mystery
100
 If 200 people were surveyed, how many prefer cheese pizza?
50
100
What is the balance point of the data set below?
3, 3, 4, 4, 6, 10
5
100
5, 6, 8, 10, 13
What is the mode of the data set above?
no mode
100
 How many people chose yellow as their favorite color?
9
100
4, 6, 7, 9, 12, 12, 13
What is the range of the data set above?
9
200

If 60 people were surveyed, how many prefer Romance movies?
18
200

How can you find the balance point of the data above without moving the Xs?
Add up the numbers and divide by how many there are
200
2, 2, 4, 8, 10, 12
What is the median of the data set above?
6
200

What percent of the children chose blue as their favorite color?
20%
200
If you have a choice between a circle graph and a bar graph, which is the best one to determine how many?
bar graph
300
 If 300 people were surveyed, how many chose sausage and supreme combined?
75
300

In order to find the balance point of the data above, what move would you make first?
Move an X from 8 to 9
300
2, 2, 3, 3, 4, 5, 9
If a 3 is added to the data set above, what impact will that have on the mean?
A. The mean will decrease.
B. The mean will stay the same.
C. The mean will increase.
A
300

What percent chose campfire or crafts?
25%
300
If 15 out of 20 people chose chocolate as their favorite flavor of ice cream, what percent will this be on a circle graph?
75%
400
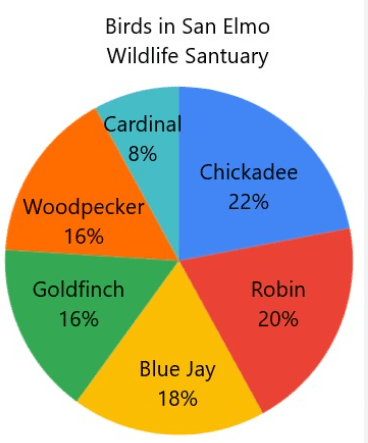
If there are 200 birds in the wildlife sanctuary, how many cardinals are there?
16
400

In order to find the balance point of the data above, what move would you make second?
Move an X from 12 to 11
400
8, 11, 14, 16, 16, 17
If a 13 is added to the data set, what effect will that have on the median?
A. The median will decrease.
B. The median will stay the same.
C. The median will increase.
A
400
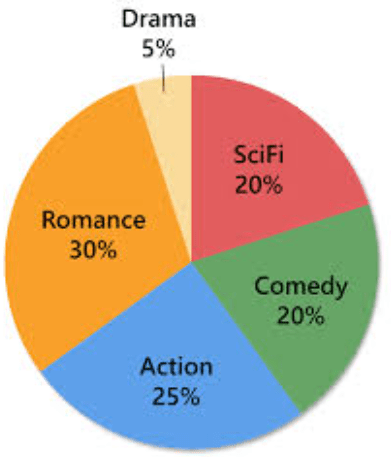
What fraction chose Romance, Action, or Comedy?
3/4
400
 What percent of the people chose peach as their favorite jelly?
20%
500

If there were 320 people surveyed, how many more people chose Action than Comedy?
16
500
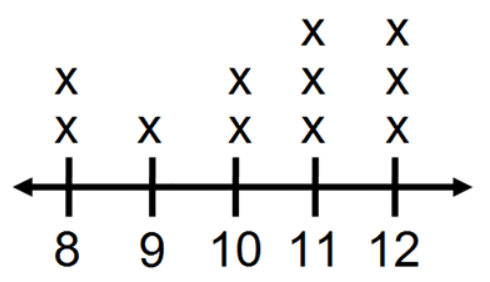
The balance point is:
A. between 9 and 10
B. between 10 and 11
C. 11
B
500
4, 5, 5, 6
Which statement is true about the data set above?
A. The mean is 4, the median is 5, the mode is 6.
B. The mean is 5, the median is 5, the mode is 5.
C. The mean is 5.5, the median is 6, the mode is 4.
B
500
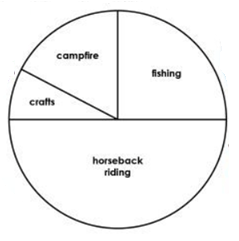
What fraction chose crafts?
1/12
500

What percent of the scoops were eaten by Amy?
32%