Mixed bag Graphs
Bar Graphs
Line Graphs
Pictographs
Pie Chart Graphs
100

Which was the least favorite sport?
Ice Hockey
100

How many students like baseball the best?
6 people
100
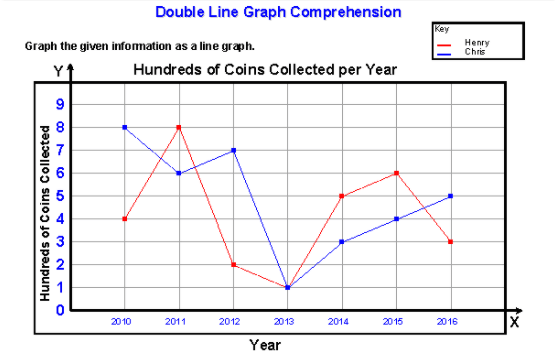 Who collected more coins in the year 2012?
Chris
100
 What is the most popular fruit?
Apples
100

What percent of people like pepperoni?
50%
200

What percentage of people liked grapes and bananas? Clue: add grapes + bananas
57%
200
How many total people completed the survey?
Clue: you must add the totals of all sports 9+7+5+2+6=
29 people
200
 Who collected 400 coins in the year 2010?
Henry
200
 Which is the least popular fruit?
Grapes
200

Which pizza topping is more popular Sausage or Supreme?
Sausage
300
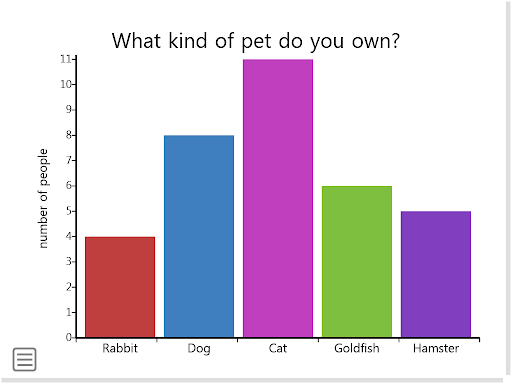
How many students own dogs?
8 students
300
How many more students like Soccer than Basketball? clue soccer minus basketball=answer
9 - 7 = 2 students
300
 What year did Henry and Chris collect the same number of coins?
2013
300
 How many more votes did bananas get than grapes?
4
300
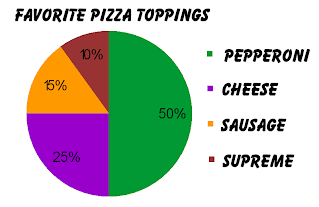
What percentage of people chose CHEESE pizza?
25%
400
 Which method of music sales only shows increase?
Streams
400
What is the favorite sport of most people?
SOCCER
400

How many hundreds of coins did Henry collect?
2900
400
 How many people voted in all?
25
400
 What is the least popular pizza topping?
Supreme
500
Which method of music sales has increased AND decreased over time?
Downloads
500
How many people picked a favorite sport that is played on a court? clue: add tennis court plus basketball court
12 people
Basketball and Tennis are played on courts, the others are played on fields or pitches
500
How many hundreds of coins did Chris collect?
3400
500
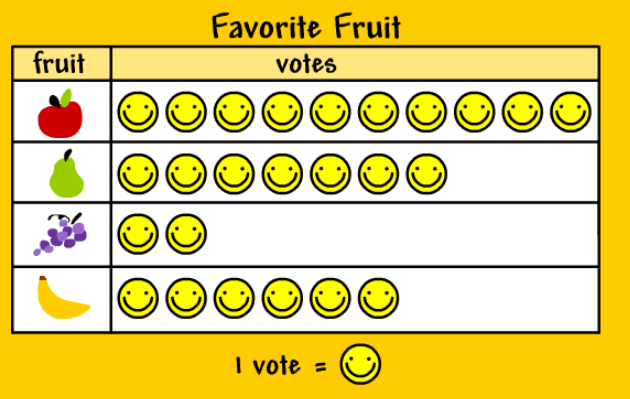 How many people voted for apples and pears?
17
500

This circle graph represents a classroom of 20 students. How many students chose pepperoni pizza?
clue: 50% is half of 20 students
10 Students