Two-Way Tables
Lines of Best Fit
Correlation Coefficient
100
A company is testing two versions of a product with a group of people to find out whether they would buy the product. How many people reviewed product version 2?

49
100
A safety inspector records the speed of a car 30 times and how far the car travels until it comes to a complete stop. Using the linear model y = 3.1x – 1, what does the slope mean in this situation?
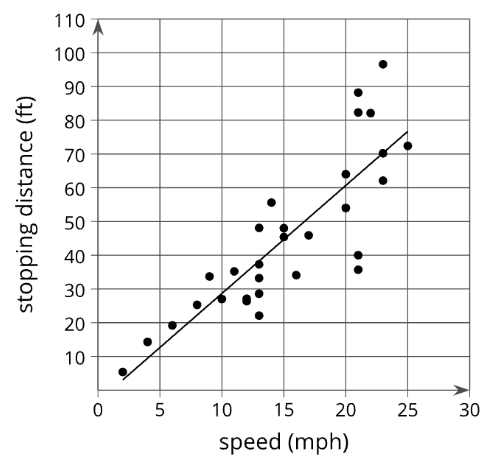
The slope means that for every extra mile per hour of speed, the car takes about 3.1 feet longer to stop.
100
Noah collects data to investigate the relationship between the number of runs scored by his favorite professional baseball team, x, and the number of runs scored by his high school baseball team, y. Which value for the correlation coefficient is most likely to match a line of best fit of the form y = mx + b for this situation?
-1
0
0.7
1
0 (no correlation)
200
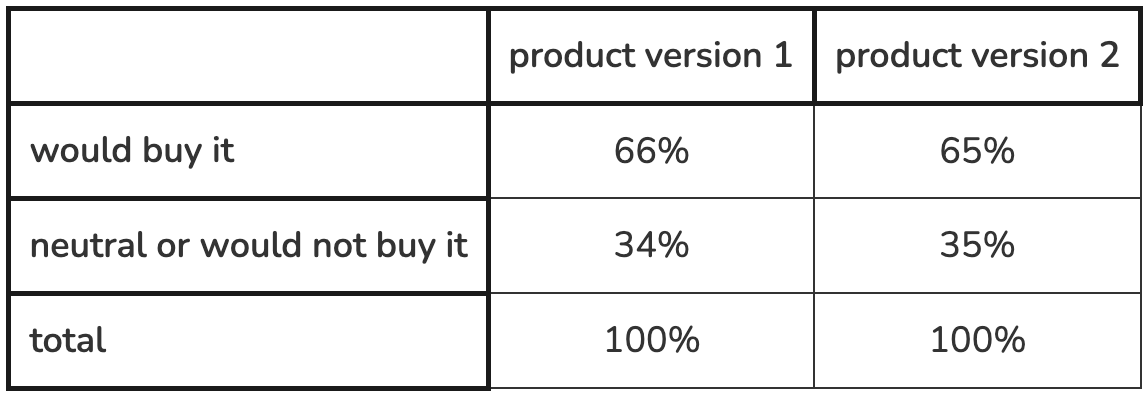
Use a relative frequency table to determine if there is an association between the product versions and whether people would buy each one. Explain your reasoning.
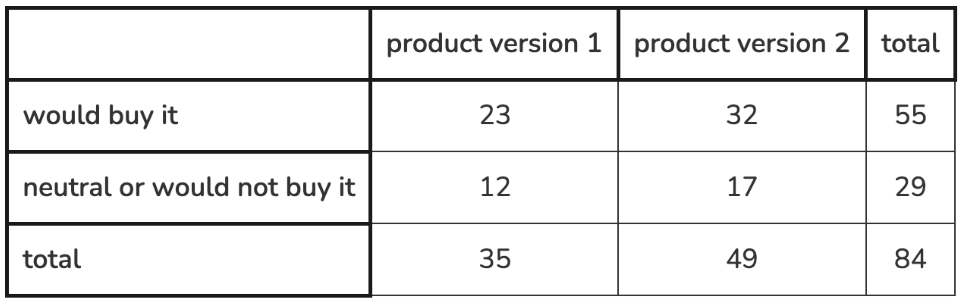
There is no association between the variables. The relative frequencies for each column are very similar and do not indicate that one version is more likely to be purchased than the other.
200
A safety inspector records the speed of a car 30 times and how far the car travels until it comes to a complete stop. Using the linear model y = 3.1x – 1, what does the y-intercept mean in this situation? Does it make sense?
The y-intercept, -1, does not make sense. If a car is going 0 miles per hour, according to the model it would stop in -1 feet, which is not possible.
200
Priya exercises and stops every so often to record the number of steps she has taken and her heart rate. When she gets home, she creates a scatter plot showing the relationship between the number of steps and her heart rate. The correlation coefficient for the data is 0.88. Describe the correlation as strong or weak and positive or negative. Explain your reasoning.
They are strongly, positively correlated. The correlation coefficient is close to 1. When Priya’s steps increase, her heart rate increases.
300
A survey is given to 1,432 people about whether they take daily supplemental vitamins and whether they eat breakfast on a regular basis. Create a relative frequency table that shows the percentage of the entire group that is in each cell.
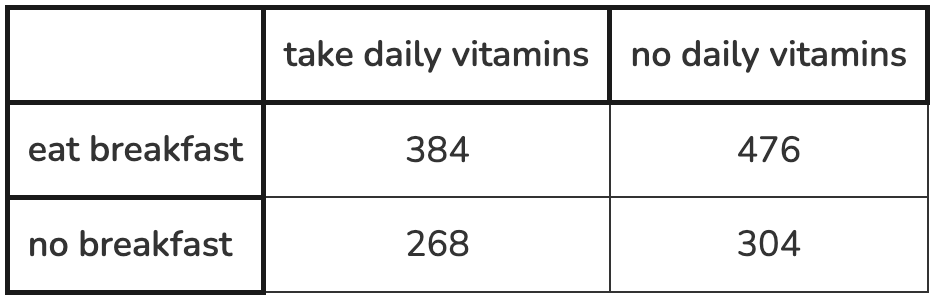
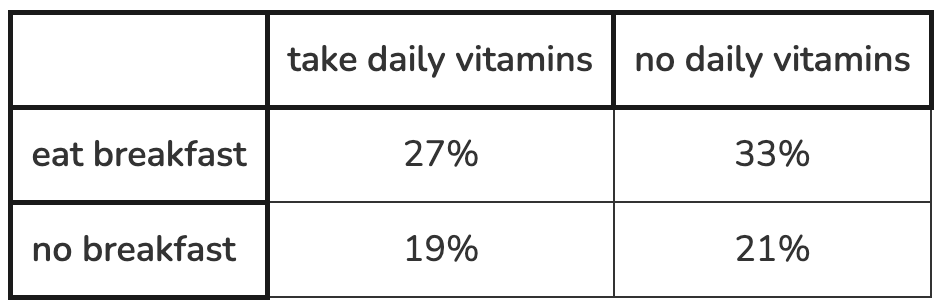
300
What is the equation of the line of best fit? Round numbers to 2 decimal places.
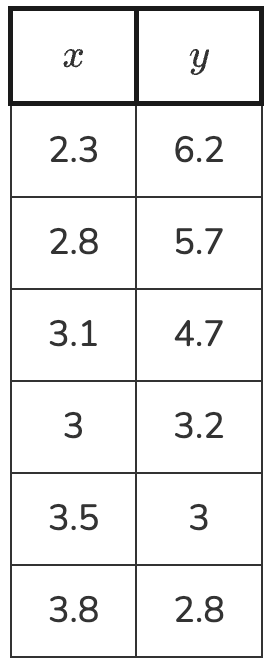
y=-2.45x+11.83
300
Priya exercises and stops every so often to record the number of steps she has taken and her heart rate. When she gets home, she creates a scatter plot showing the relationship between the number of steps and her heart rate. The correlation coefficient for the data is 0.88. Do you think either of the variables causes the other to change? Explain your reasoning.
No, probably not. It is likely that the type of exercise is the cause of both variables. For example, running on a treadmill would increase both the number of steps Priya takes and her heart rate. A long, slow walk would probably not raise her heart rate in the same way that a short, fast run would, even if the number of steps were the same.
400
An automobile dealership keeps track of the number of cars and trucks they have for sale as well as whether they are new or used. Create a relative frequency table. Explain why you chose to use the row totals or column totals in your calculations.
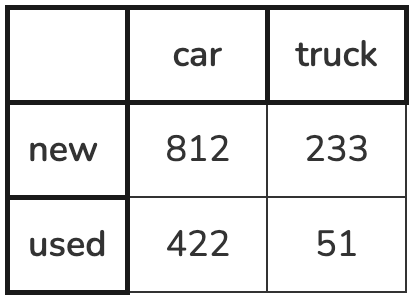
Row:
new car = 78%
new truck = 22%
used car = 89%
used truck = 11%
Column:
new car = 66%
used car = 34%
new truck = 82%
used truck = 18%
400
A seed is planted in a glass pot, and its height is measured in centimeters every day. The best-fit line is given by the equation y = 0.404x – 5.18, where y represents the height of the plant above ground level, and x represents the number of days since it was planted.
What is the slope of the best-fit line? What does the slope of the line mean in this situation? Is it reasonable?
0.404. It means that each day the plant grows about 0.404 centimeters taller. This is fairly reasonable since a young plant should grow, and this number is reasonable for the amount a young plant grows.
400
Kiran creates a scatter plot showing the relationship between the number of students attending drama club and the number of students attending poetry club each week. The correlation coefficient for the data is -0.36. Describe the correlation as strong or weak and positive or negative. Explain your reasoning.
They are weakly, negatively correlated. The correlation coefficient is negative and near 0. It appears that as the number of students attending one of these clubs increases, the number of students attending the other club tends to decrease.
500
The purchasing habits of 1,000 grocery shoppers are noted. No association is found between the variables. Fill in the empty portion of the table with values that would support this claim. Explain your reasoning.
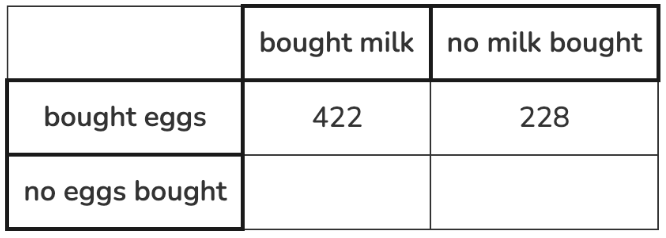
The sum of the two values should be 350, with approximately 65% of these shoppers having bought milk and no eggs, while the remaining 35% bought neither milk nor eggs.
Sample response: 227 bought milk and no eggs. 123 bought neither milk nor eggs.
500
A seed is planted in a glass pot, and its height is measured in centimeters every day. The best-fit line is given by the equation y = 0.404x – 5.18, where y represents the height of the plant above ground level, and x represents the number of days since it was planted.
What is the y-intercept of the best-fit line? What does the y-intercept of the line mean in this situation? Is it reasonable?
(0, -5.18) It means that on day 0, when the seed was planted, it was 5.18 centimeters below the surface of the ground. This is reasonable since seeds are planted below the surface, and about 5 centimeters seems like the right amount.
500
Kiran creates a scatter plot showing the relationship between the number of students attending drama club and the number of students attending poetry club each week. The correlation coefficient for the data is -0.36. Do you think either of the variables causes the other to change? Explain your reasoning.
There is not evidence for causality. Any relationship between the variables is likely due to another cause, such as other events at the school conflicting with the club meeting time.