Vocab and Variables
SI Units
Dimensional Analysis (Units)
Density
Graphs
100
Maria noticed that the plants in her backyard grew taller on the side that received more sunlight. She wondered if the amount of sunlight affected how fast plants grow. To test this, she designed an experiment using three identical pots of bean plants. She placed one pot in full sunlight, one in partial sunlight, and one in the shade. She gave all the plants the same amount of water and soil. Over three weeks, Maria measured the height of the plants every two days and recorded her data. At the end of the experiment, she determined which plant grew tallest. After analyzing her results, she concluded that the plants in full sunlight grew the fastest.
What is the independent variable? What is the dependent variable?
Independent variable: Amount of sunlight
Dependent variable: Growth rate of plants
100
SI Unit for Time?
Seconds (S)!
100
How many meters (m) are in 1 millimeter (mm)?
1mm = .001m (same as 1000mm = 1m)
100
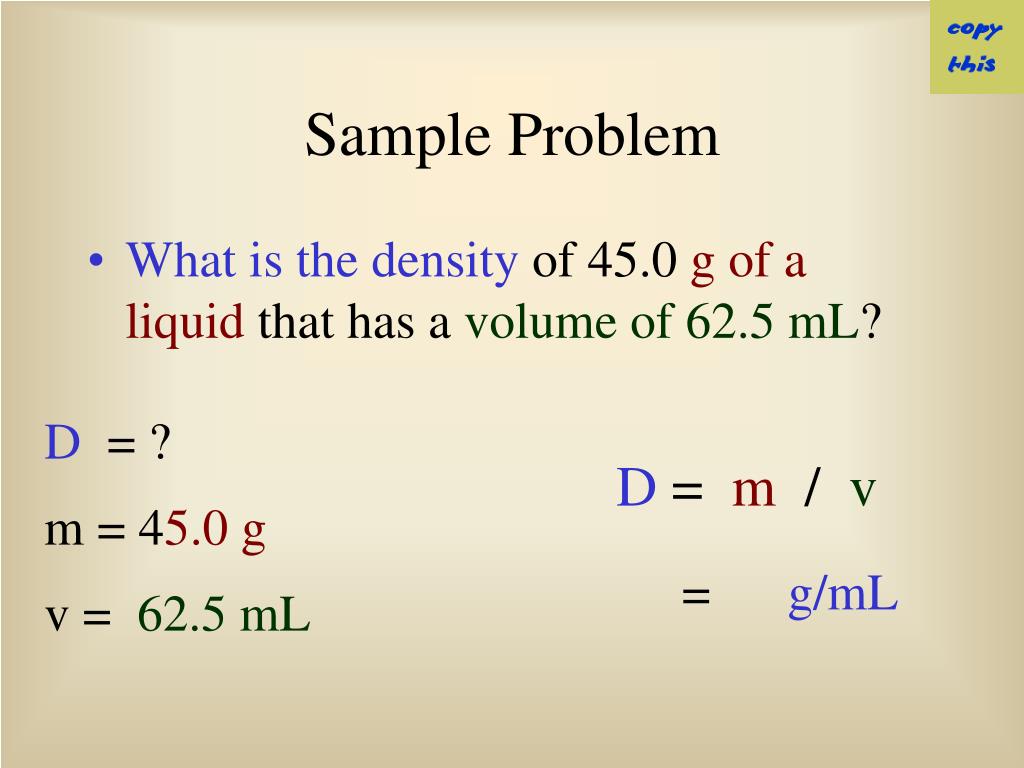
D = .72 g/ml
100

What kind of graph is this?
Bar!
200
Maria noticed that the plants in her backyard grew taller on the side that received more sunlight. She wondered if the amount of sunlight affected how fast plants grow. To test this, she designed an experiment using three identical pots of bean plants. She placed one pot in full sunlight, one in partial sunlight, and one in the shade. She gave all the plants the same amount of water and soil. Over three weeks, Maria measured the height of the plants every two days and recorded her data. At the end of the experiment, she determined which plant grew tallest. After analyzing her results, she concluded that the plants in full sunlight grew the fastest.
What is the control (1), what are the constants (2)?
Control: Full sunlight
Constants: three weeks, same soil, same water
200
SI unit for Mass?
Grams (g)!
or
Kilograms (Kg)!
200
4.6 liters (L) is how many milliliters (mm)?
4.6L X 1000mm/1m
= 4600 mm
200
Mass = 3.7 g
Volume = 43.6 ml
Density = .085 g/ml
200
Is time relevant to this pie graph (circle graph)?
No! Time doesn't matter!
300
Place the steps of the scientific process in the correct order
A. Conclusion B. Hypothesis C. Experiment D. Data analyze E. Question/problem
1 - E. Question/problem
2 - B. Hypothesis
3 - C. Experiment
4 - D. Data analyze
5 - A. Conclusion
300
SI Unit for Length?
Meters (m)!
300
7.34 centigrams (cm) is how many grams (g)?
7.34 cm X 1g/100cm
= .0734 grams
300
Density = 97 g/cm^3
Volume = 3 cm^3
Mass = 291 g
300

What would be the number of bicycles sold half way through April?
25 bicycles
400
Hypothesis vs Theory
Tell me the difference!
Theory is more general and less scientific, "I wonder if..."
Hypothesis is a required part of the scientific method, more structured and scientifically based, "If/Then/Because"
400
How many millimeters are in 1 meter?
1000 mm = 1 m
400
How many centimeters (cm) are in 1 foot (ft)?
1ft X 12in/1ft X 2.54cm/1in
= 30.48 cm
400
Mass = 16g
Density = 54 g/ml
volume = .296 ml
400
What is the only difference between a scatter plot (graph) and a line graph?
Line graph has all of its data connected by a line.
Scatter plots can have a line to show the pattern but the points are not connected.
500
What is bias?
Bias is accidental or purposeful errors in data collection methods, data analyze, or conclusion forming
(like asking a classroom full of boys what their favorite color is and then saying that their answer is accurate for boys and girls at that school)
500
How many meters are in 10 kilometer?
10 km = 10000 m
500
How many millimeters (mm) is in 3.75 kilometers (km)?
3.75km X 1000m/1km X 100mm/1m
= 3,750,000 mm
500
Volume = 6.7 ml
Mass = 14 g
Density = 2.09 g/ml
500

Why is this not a bar graph?
Because there are not spaces so it is a histogram!