COLUMN 1
COLUMN 2
COLUMN 3
COLUMN 4
COLUMN 5
100
Mode is defined as...
The number that happens most often.
100
Find Q1, Q3, Median, Minimum, and Maximum
11, 12, 13, 11, 12, 15, 18, 16, 19, 21, 22
Minimum- 11
Q1- 12
Median- 15
Q3- 19
Maximum- 22
100
True or false: the mean, mode, median, and range are included in a five number summary.
False, it's just the median.
100
What is the mode?
The number that occurs most often in a set of data.
100
The three measures of central tendency are a single number that ___________ all the values in a data set.
summarizes
200
The range is defined as...
The largest number minus the smallest number.
200
What is this called?

Dot Plot
200
What is the other name for a box plot?
A box and whisker plot
200
Find the mean of the set:
2, 5, 5
4
200
The average score on the last 6th grade math test.
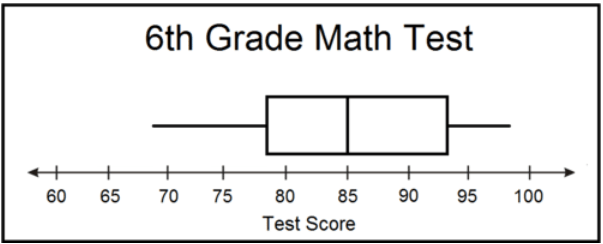
What is the five number summary?
min = 68
Q1 = 78
med = 85
Q3 = 93
max = 98
300
Explain the steps to find the mean.
1. Add all the data
2. Divide by the number of numbers
300
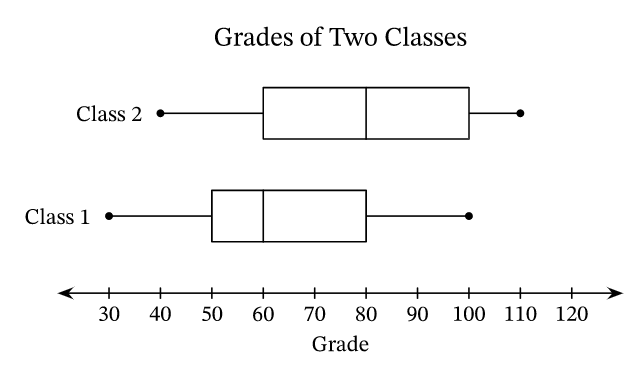 What is the range for class 1 and class 2?
Class 1 = 70
Class 2 = 70
300
What are the three shapes of a dot plot?
Symmetric
Skewed Left
Skewed Right
300
Find the mode of the following set of data
11, 12, 13, 11, 12, 15, 18, 16, 19, 21, 22, 12
12
300
Find the median of the set (put the numbers in order first!).
11, 12, 13, 11, 12, 15, 18, 16, 19, 21, 22
15
400
How do you find the median?
1. Put the numbers in order from small to large.
2. Find the middle.
400
What is this called?

Box Plot
400
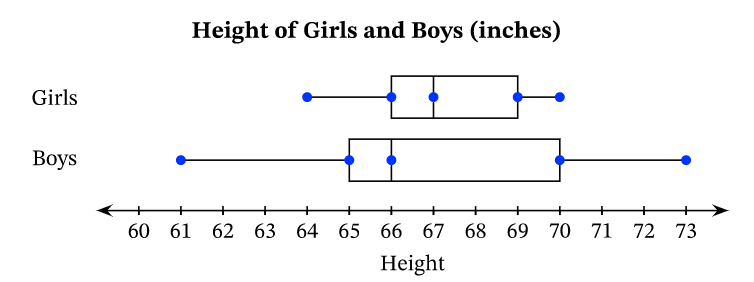
What is the IQR for Boys and Girls?
Girls = 3
Boys = 5
400
What are two characteristics of a histogram?
1. The bars are touching
2. Each bar represents a range of numbers
400
Explain how to find the range.
Subtract the smallest number from the largest one.
500
How do you find the IQR?
1. Put the numbers in order from big to small.
2. Find the median.
3. Find the middle of the lower half.
4. Find the middle of the upper half.
5. Subtract the two numbers.
500
Find the IQR if Q3 is 120 and Q1 is 70.
50
500
Which data most likely have variability for one school during a single school year?
A. The number of students absent each day
B. The amount of time for lunch each day
C. The cost of a slice of cheese pizza each day
A
500
Explain how to find the mean of a set of data.
Add up all the numbers and divide by the amount of numbers given.
500
List three types of graphs we have learned.
Dot Plot
Stem-and-Leaf Plot
Histogram
Box Plot