Biased or Unbiased?
MCT/Experiment Design
Experiment Design
The Daily Double - MCT
Final Jeopardy - MCT
100
A shoe manufacturer wants to check the quality of its shoes. Every
twenty minutes, 20 pairs of shoes are pulled off the assembly line for a quality inspection.
Identify the sample as biased or unbiased. Explain
Unbiased, because it is a random selection (Systematic).
100
Which measure of central tendency best represents the data? Justify your answer.
The Brady family keeps track of its monthly electric bills: {$134, $122, $128, $127, $136, $120, $129}
Mean, because there are no outliers and not many repeating numbers.
100
A local newspaper surveyed 530 randomly chosen Eastwich residents.
Identify The sample & Population
Sample: 530 randomly chosen Eastwich residents Population: Eastwich residents
100
{10, 18, 22, 23, 26, 26, 26, 28, 30, 31, 31, 32, 33, 34, 46}
What is the median?
What is the lower quartile?
What is the upper quartile?
What is the interquartile range?
What is the bottom boundary of the data?
What is the upper boundary of the data?
Are there any outliers beyond those boundaries? If so, what are they?
{10, 18, 22, 23, 26, 26, 26, 28, 30, 31, 31, 32, 33, 34, 46}
Median: 28
Lower Quartile: 23
Upper Quartile: 32
Interquartile Range: 9
Bottom Boundary: 9.5
Upper Boundary: 45.5
Outliers: 46
100
•The speeds (mph) of 20 of the fastest land animals are listed.
•Arrange the data from least to greatest:
•32, 32, 35, 35, 35, 36, 40, 40, 40, 40, 42, 43, 45, 45, 48, 50, 50, 50, 61, 70
•What is the minimum?
•What is the maximum?
•What is the range?
•What is the mean? (round to the nearest tenth)
•What is the median?
•What is the mode?
•What is the lower quartile?
•What is the upper quartile?
•What is the interquartile range?
•Make a Box & Whisker Plot
•{10, 18, 22, 23, 26, 26, 26, 28, 30, 31, 31, 32, 33, 34, 46}
•Median: 28
•Lower Quartile: 23
•Upper Quartile: 32
•Interquartile Range: 9
•Bottom Boundary: 9.5
•Upper Boundary: 45.5
•Outliers: 46
200
To learn which benefits employees at a large company think are most important, the management has a computer select 50 employees at random. The employees are then interviewed by the Human Relations department.
Identify if the sample is biased or unbiased. Explain.
Unbiased, it is simple random selection.
200
Determine whether the display gives an accurate picture of the survey results. Explain.
A local news broadcast commissioned a poll of 3000 randomly chosen voters.
Question: Do you prefer pizza, hotdogs, or hamburgers?
Conclusion: Voters overwhelmingly prefer hot dogs
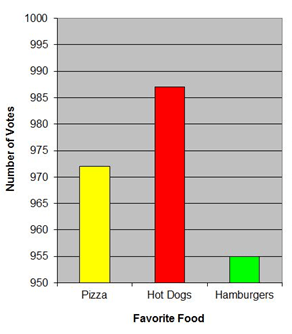
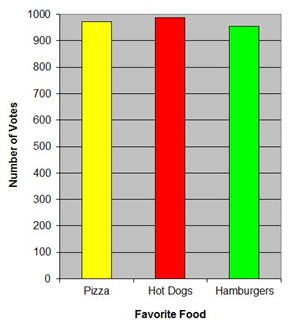
No, because the graph does not start at 0, so the columns appear to be more different than they are.
The correct graph would look like this:
200
An insurance company checks every hundredth claim payment to ensure that claims have been processed correctly.
Identify:
The sample
Population
Random Sample Type (Simple, Stratified, or Systematic)
•Sample: Every 100th claim
•Population: All claims at that insurance company
•Random Sample Type: Systematic
300
Suppose you want to know if a manufacturing plant is discharging contaminants into a local river. Describe an unbiased way in which you could check the river for contaminants.
Is your description a simple, stratified, or systematic sampling?
If so, then it’s a random sampling, so it is unbiased!
300
Jeremiah wants to determine how often males are represented on TV versus females, so he picks 1 show per hour to watch for one day and counts how many males he sees versus females.
Identify:
The sample
Population
Type of Data Collection (survey, observational study, or experiment).
Random Sample Type: (Simple, Stratified, or Systematic).
Sample: The 1 show per hour that day.
Population: All shows on TV
Data Collection Type: Observational Study
Random Sample Type: Systematic
300
•At a town council meeting, the chair asks 5 citizens attending for their opinions on whether to approve rezoning for a residential area.
Identify:
The sample
Population
Which type of data collection was used (survey, observational study, or experiment)
Which type of random sample is taken (Simple, Stratified, or Systematic).
•Sample: The 5 citizens
•Population: The members of the meeting or the town are acceptable answers.
•Data Collection Type: Survey
•Random Sample Type: Simple
400
Chris polled 16 of his friends during study hall to determine if teachers assign too much homework.
Identify if the sample is biased or unbiased. Explain.
Biased, because the selection is not random. It is biased towards his friends and students who take study hall.
400
Ernesto took a poll of randomly selected students at his high school and asked them what their opinion of the prom theme was.
Identify:
The sample & Population
Sample: The randomly selected students at Ernesto’s high school
Population: Students at Ernesto’s high school.
400
A local news broadcast commissioned a poll of 600 randomly chosen Providence residents.
Identify The sample & Population
•Sample: The 600 randomly chosen Providence residents.
•Population: Providence residents.
500
Suppose you want to know the issues most important to teachers at your school. Describe an unbiased way in which you could conduct your survey.
Is your description a simple, stratified, or systematic sampling?
If so, then it’s a random sampling, so it is unbiased!
500
To determine the extent of leaf blight in the maple trees at a nature preserve, a botanist divides the reserve into 10 sections, randomly selects a 200-foot by 200-foot square in each section, and then examines all the maple trees in those section.
Identify:
The sample
Population
Data Collection Type (survey, observational study, experiment)
Type of Random Sample (Simple, Stratified, or Systematic)
Sample: The 200 by 200 feet in each section
Population: The maple trees in the nature preserve
Data Collection Type: Experiment
Random Sample Type: Stratified