The Basics
Real Life
Biostats Potporri
Names & Sources
100
A researcher is comparing how fast 2 groups of people finish the upcoming Greenville Marathon. The researcher separated the groups based on pacing methods. A t-test was used to determine if different pacing methods led to statistically significant results, this value was generated.
What is a p-value?______________________________________Explanation: If the p-value is less than 0.5, then the pacing methods led to statistically significant results.

100
A researcher would use this kind of test to determine if serum sodium levels between patients that have chronic kidney disease and patients who are healthy were statistically significant.
What is a T-Test?______________________________________Explanation: A T-test is used to compare quantitative data between 2 groups.
For more info: https://www.khanacademy.org/math/ap-statistics/two-sample-inference/two-sample-t-test-means/v/two-sample-t-test-for-difference-of-means
100
This is the most commonly used p-value indicating statistical significance.
What is <0.05?________________________________________
Explanation: A small p-value (typically ≤ 0.05) indicates strong evidence against the null hypothesis, so you reject the null hypothesis. Similarly, this means that the observed results are unlikely to have occurred by chance and there is a correlation between the two values.
100
Who are Harrison Lancaster, Kelly Briggs, Hunter Jackson?
Group members
Hunter Jackson - Submission of 1st assignment (group member names/title/general description) The Basics 100,200; Real Life 100; Potpourri 100
Kelly Briggs - The Basics 400; Real life 400; Potpourri 200, 400
Harrison Lancaster - creation of game template on Jeopardylabs.com; The Basics 300; Real Life 200, 300; Potpourri 300
Content editing provided by all three group members.
200
This kind of statistical hypothesis test checks differences between means of two groups.
What is a T-Test?______________________________________Explanation: A T-test is used to compare quantitative data between 2 groups.
From First Aid:

200
A researcher is using this kind of test to compare hormone levels of patients in 3 groups: non-pregnant, pregnant, and post-partum.
What is an ANOVA test?_____________________________________
Explanation: An ANOVA test is used to compare quantitative data when there are more than 2 groups.
200
A researcher used Chi-Squared analysis and found that only 20% of patients in group A are heavy exercisers, while 30% of patients in group B are heavy exercisers. The researcher was comparing this type of data.
What is categorical data?______________________________________Explanation: The research is using a survey with the possible responses being either “yes” or “no” answers only; self-identifying as a heavy exerciser is not something that can be quantitatively measured. Categorical data is typically assessed via Chi squared analysis.
200
1. Genser B, Cooper PJ, Yazdanbakhsh M, Barreto ML, Rodrigues LC. A guide to modern statistical analysis of immunological data. BMC Immunol. 2007;8:27. Published 2007 Oct 26. doi:10.1186/1471-2172-8-27
2. Le, T., Bhushan, V., Sochat, M., Sylvester, P., Mehlman, M., & Kallianos, K. (2018). First aid for the USMLE step 1 2018. New York: McGraw-Hill Medical.
3. Nayak BK, Hazra A. How to choose the right statistical test?. Indian J Ophthalmol. 2011;59(2):85-6.
4. Spears, Tom. “Science World's p-Value Controversy: Little Number, Big Problem.” Ottawa Citizen, 25 Mar. 2016, ottawacitizen.com/technology/science/science-worlds-p-value-controversy-little-number-big-problem.
5. Yan F, Robert M, Li Y. Statistical methods and common problems in medical or biomedical science research. Int J Physiol Pathophysiol Pharmacol. 2017;9(5):157-163. Published 2017 Nov 1.
What are our sources?
300
This kind of statistical test checks differences among the means of more than 2 groups?
What is the ANOVA test?____________________________________
Explanation: ANOVA is used to compare differences of means among more than 2 groups. It looks at variation in the data and where that variation is found (hence its name).
Specifically, ANOVA compares the amount of variation between groups with the amount of variation within groups.
From First Aid:

300
A two year study was conducted to assess the efficacy of anti-seizure drugs between two groups of 50 people. Group A was given a type of anti-seizure called Delantin, while group B was given a new drug called Doobieamazepine. The alpha value allocated for the outcome of the study is 0.5. After a 3 year period, group A reported a mean number of seizures of 2.0, while group B reported a mean value of 8.2. The results of the study, while clinically significant, were deemed statistically insignificant because the p-value was this in relation to the pre-determined alpha value.
What is lower?______________________________________
Explanation: A test-statistic is statistically significant if its p-value is lower than the predetermined alpha value.
300
The following data set would be best analyzed with this statistical test.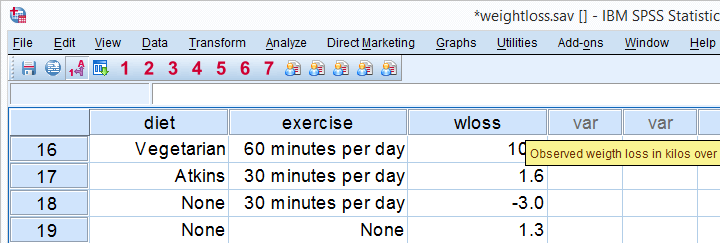
What is an ANOVA test?_______________________________________
Explanation: The data set has 4 mean weight loss values (vegetarian & exercise, atkins & exercise, exercise alone, and no intervention) so the ANOVA is most appropriate (>2 mean values) to analyze for statistical significance.
400
This test is used to investigate differences between two or more PERCENTAGES or PROPORTIONS of categorical data.
What is a Chi-Square (χ² test)? ________________________________________
Explanation: Unlike a t-test or ANOVA test, Chi-square tests test categorical data and not average means. It is used to determine whether there is a significant difference between the expected frequencies and the observed frequencies in one or more categories. Below is a sample of categorical data:
400
The CDC is investigating hospitalizations due to pediatric asthma among children living in certain major US cities in 2018. This statistical test would be the most appropriate to compare the following data.
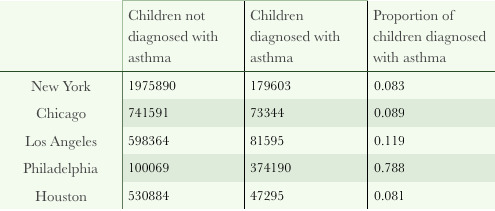
What is Chi-squared?________________________________________
Explanation: Chi squared statistical tests are the most appropriate statistical test for evaluation of relationships between two or more categorical variables.
400
The USCSOM-Greenville wants to compare the last four graduating classes. This statistical test would be the most appropriate for specifically comparing the persistence of specialty choice between matriculation and 3rd year (ie proportion of students whose specialty choice at year 3 is the same as upon matriculation).
What is chi squared? ______________________________________Explanation:Chi squared statistical tests are the most appropriate statistical test for evaluation of relationships between two or more categorial variables. In this example, the categorical variables are i) graduating class and ii) proportion of students whose intended specialty was the same as specialty choice at year 3.