Births and Deaths
Energy Storage Molecules
Levels of the Ecosystem
Food Webs OR Line Graphs
Estimating Population Size OR Line Graphs
100
1. A population of tigers lives in Bangladesh. Over 50 years, the size of the tiger population increased. What best explains the increase in the size of the tiger population?
(a) A lot of tigers were born and none of them died.
(b) The tiger population is always increasing because no animal eats tigers.
(c) Fewer tigers were born than died.
(d) More tigers were born than died.
(d) More tigers were born than died.
100
Provide one example of energy storage molecules and how they relate to reproduction.
Possible examples include:
- starch
- glucose
- fats
Organisms break down energy storage molecules to get the energy required for reproduction.
100
Write two examples of ecosystems.
Accepted responses may be:
- forests
- rainforests
- deserts
- oceans
- coral reefs
100
Study the food web model below, which depicts some populations that interact with the cane toad in Australia.
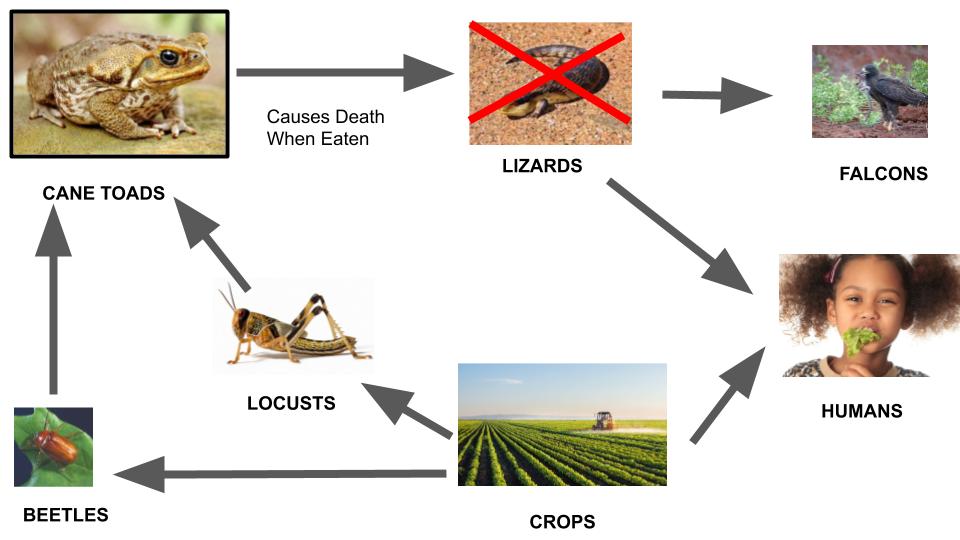
Which of the following statements is true?
(a) The crops are the only resource population.
(b) The cane toad population will eat all of the locusts and beetles, causing destruction of the ecosystem.
(c) The locusts are both a resource and consumer population in this ecosystem.
(d) Humans can find other resources, so they will not be affected by the cane toad population.
(c) The locusts are both a resource and consumer population in this ecosystem.
100
Describe what is happening to population size over time by looking at the line graph below:
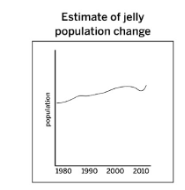
The jelly population increased slightly over time.
200
A population of bluefish lives in the Gulf of Mexico. Over the last 50 years, the size of the bluefish population has decreased. What best explains the decrease in the size of the bluefish population?
(a) A lot of bluefish died and no new bluefish were born.
(b) More bluefish were born than died.
(c) Fewer bluefish were born than died.
(d) The bluefish population is always decreasing because bluefish are always being eaten.
(c) Fewer bluefish were born than died.
200
Scientists have been studying the size of three populations in a grassland. In this ecosystem, lizards eat fireflies, and fireflies eat gnats (a type of insect). The data showed that all three populations were stable. Then the lizard population decreased suddenly. What will most likely happen to the size of the firefly population as a result?

The firefly population will . . .
(a) increase. The smaller lizard population will need fewer energy storage molecules so they will eat fewer fireflies. This will lead to fewer deaths than births in the firefly population.
(b) increase. The smaller lizard population will leave more energy storage molecules available for the firefly population to reproduce more. This will lead to more births in the firefly population.
(c) stay the same. The size of its resource population did not change, so the amount of energy storage molecules available for the fireflies did not change. There will be the same number of births and deaths in the firefly population.
(d) decrease. A decrease in any population causes a decrease in the sizes of all other populations in the ecosystem.
(a) increase. The smaller lizard population will need fewer energy storage molecules so they will eat fewer fireflies. This will lead to fewer deaths than births in the firefly population.
200
Define "population" and explain its relation to:
- organisms
- communities
- ecosystems
Population: a group of the same type of organism living in the same area
Populations of different species in a close proximity to each other, sharing resources, are part of a community, and a community plus the non-living factors are considered an ecosystem.
200
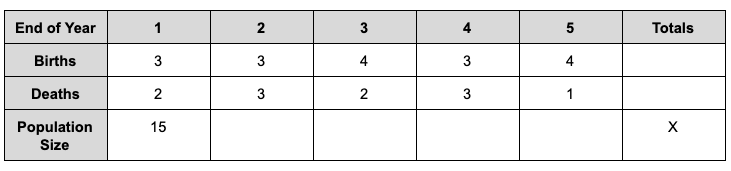
The following table depicts births and deaths in the Bensonhurst stray cat population. The population size in year 0 was 14. At the end of the Year 1, after 3 births and 2 deaths, the population is given (as 15). Complete the table, filling out:
- the the population size
- the total number of births
- the total number of deaths
200
Describe what is happening to population size over time by looking at the line graph below: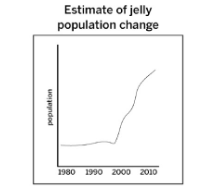
The jelly population remained mostly stable from 1980 to 2000 and then increased from 2000 to 2010.
300
In the Arctic Ocean, sharks eat whales, and whales eat crabs. In the last 10 years, the sizes of the populations have been stable, but recently the size of the crab population increased. What will likely happen to the shark population?
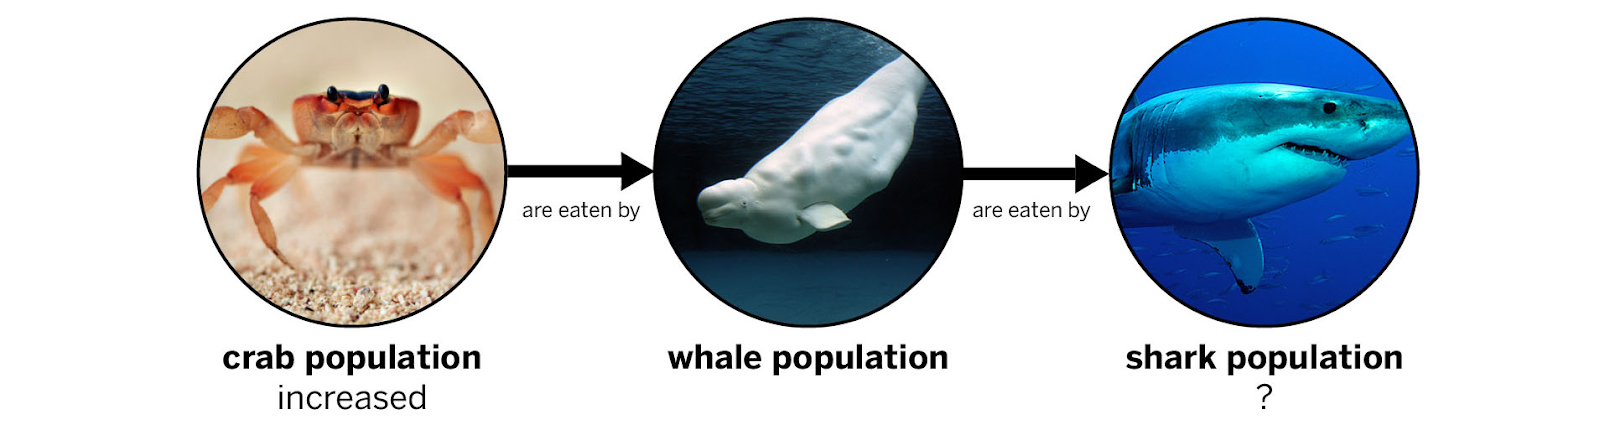
(a) decrease. The larger crab population will leave fewer energy storage molecules available in the ecosystem for the shark population, so there would be fewer births in the shark population.
(b) increase. An increase in the size of any population leads to an increase in the sizes of all other populations in an ecosystem.
(c) increase. More energy storage molecules will be available to the shark population from the larger whale population, so the shark population will reproduce more. This will lead to more births than deaths in the shark population.
(d) stay the same. Sharks do not eat crabs, so the number of births and deaths in the shark population will stay the same.
(c) increase. More energy storage molecules will be available to the shark population from the larger whale population, so the shark population will reproduce more. This will lead to more births than deaths in the shark population.
300
Scientists have been studying the size of three populations in a region. In this ecosystem, lions eat wild pigs, and wild pigs eat frogs. The data showed that all three populations were stable. Then the frog population decreased suddenly. What will likely happen to the size of the wild pig population as a result?

The size of the wild pig population will . . .
(a) increase. The smaller frog population will need fewer energy storage molecules so there will be more energy storage molecules available to the wild pig population. This will lead to more births in the wild pig population.
(b) decrease. The smaller frog population will provide fewer energy storage molecules for the wild pig population, so the wild pig population will reproduce less. This will lead to fewer births than deaths in the wild pig population.
(c) decrease. A decrease in any population causes a decrease in the sizes of all other populations in an ecosystem.
(d) stay the same. The size of their consumer population did not change, so the number of deaths in the wild pig population did not change. There will be the same number of births and deaths in the wild pig population.
(b) decrease. The smaller frog population will provide fewer energy storage molecules for the wild pig population, so the wild pig population will reproduce less. This will lead to fewer births than deaths in the wild pig population.
300
What is one measure of ecosystem health?
(HINT: You read about this in an article for homework)
DOUBLE POINTS: Define the word in your response.
Biodiversity
Double Points: Biodiversity is a word that ecologists use to describe how much variety there is in an ecosystem: in other words, how many different species are part of the ecosystem.
300
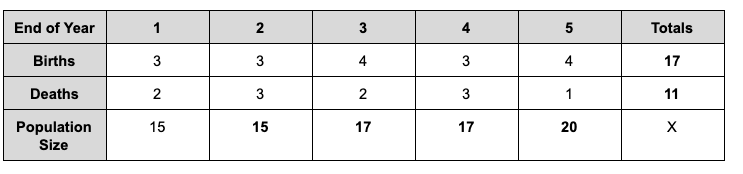
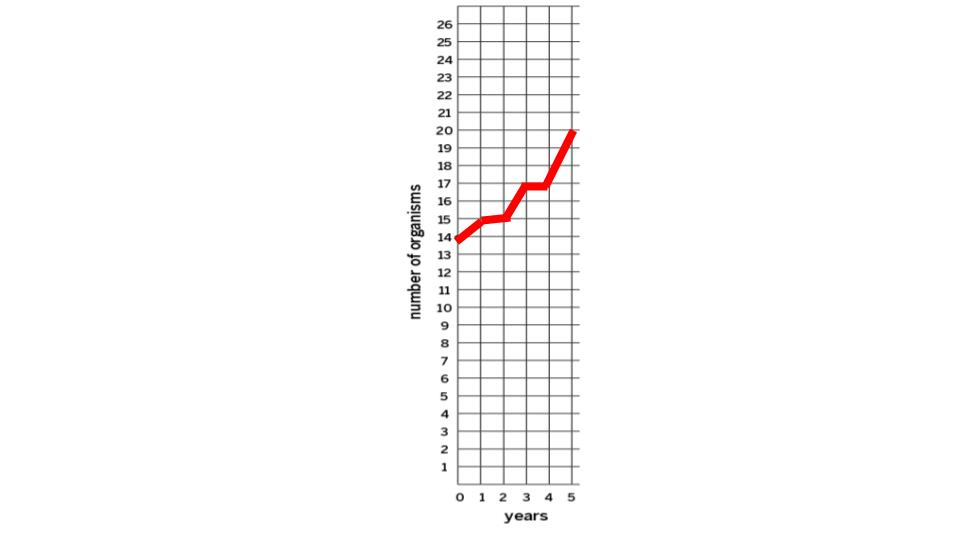
Use the data in the table to construct a line graph representing the year and population size:
300
Explain why the line in the line graph is not a perfectly straight line:

In real life, population size fluctuates each year, and does not always steadily increase. However, when we look at data, we can look at the overall trend.
400
Scientists have been studying the size of three populations in Peru. In this ecosystem, pumas (large wild cats) eat deer, and deer eat grass. The data showed that all three populations were stable. Then the puma population increased suddenly. What will most likely happen to the size of the deer population as a result?
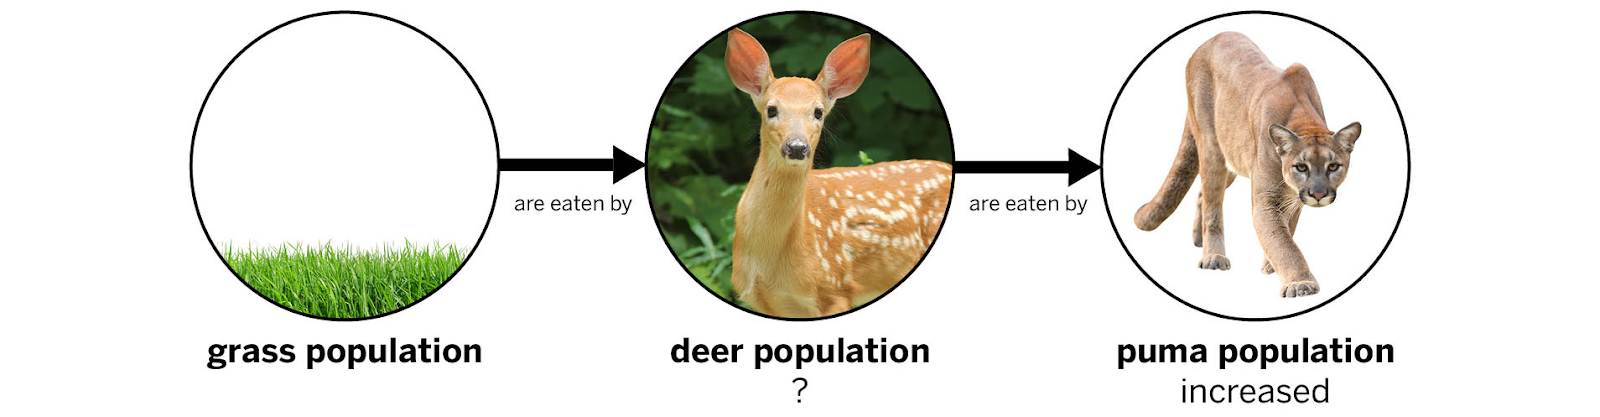
The size of the deer population will . . .
(a) stay the same. The size of their resource population did not change, so the amount of energy storage molecules available for the deer did not change. There will be the same number of births and deaths in the deer population.
(b) increase. An increase in the size of one population leads to an increase in the sizes of all other populations in the ecosystem.
(c) decrease. The larger puma population will leave fewer energy storage molecules available in the ecosystem for the deer. The deer population will reproduce less, leading to fewer births in the deer population.
(d) decrease. The larger puma population will need more energy storage molecules, so they will eat more deer. This will lead to more deaths than births in the deer population.
(d) decrease. The larger puma population will need more energy storage molecules, so they will eat more deer. This will lead to more deaths than births in the deer population.
400
In Australia, both opossums and foxes eat rats. The sizes of the populations have been stable for the last 12 years, but recently the size of the opossum population increased. What will likely happen to the fox population?
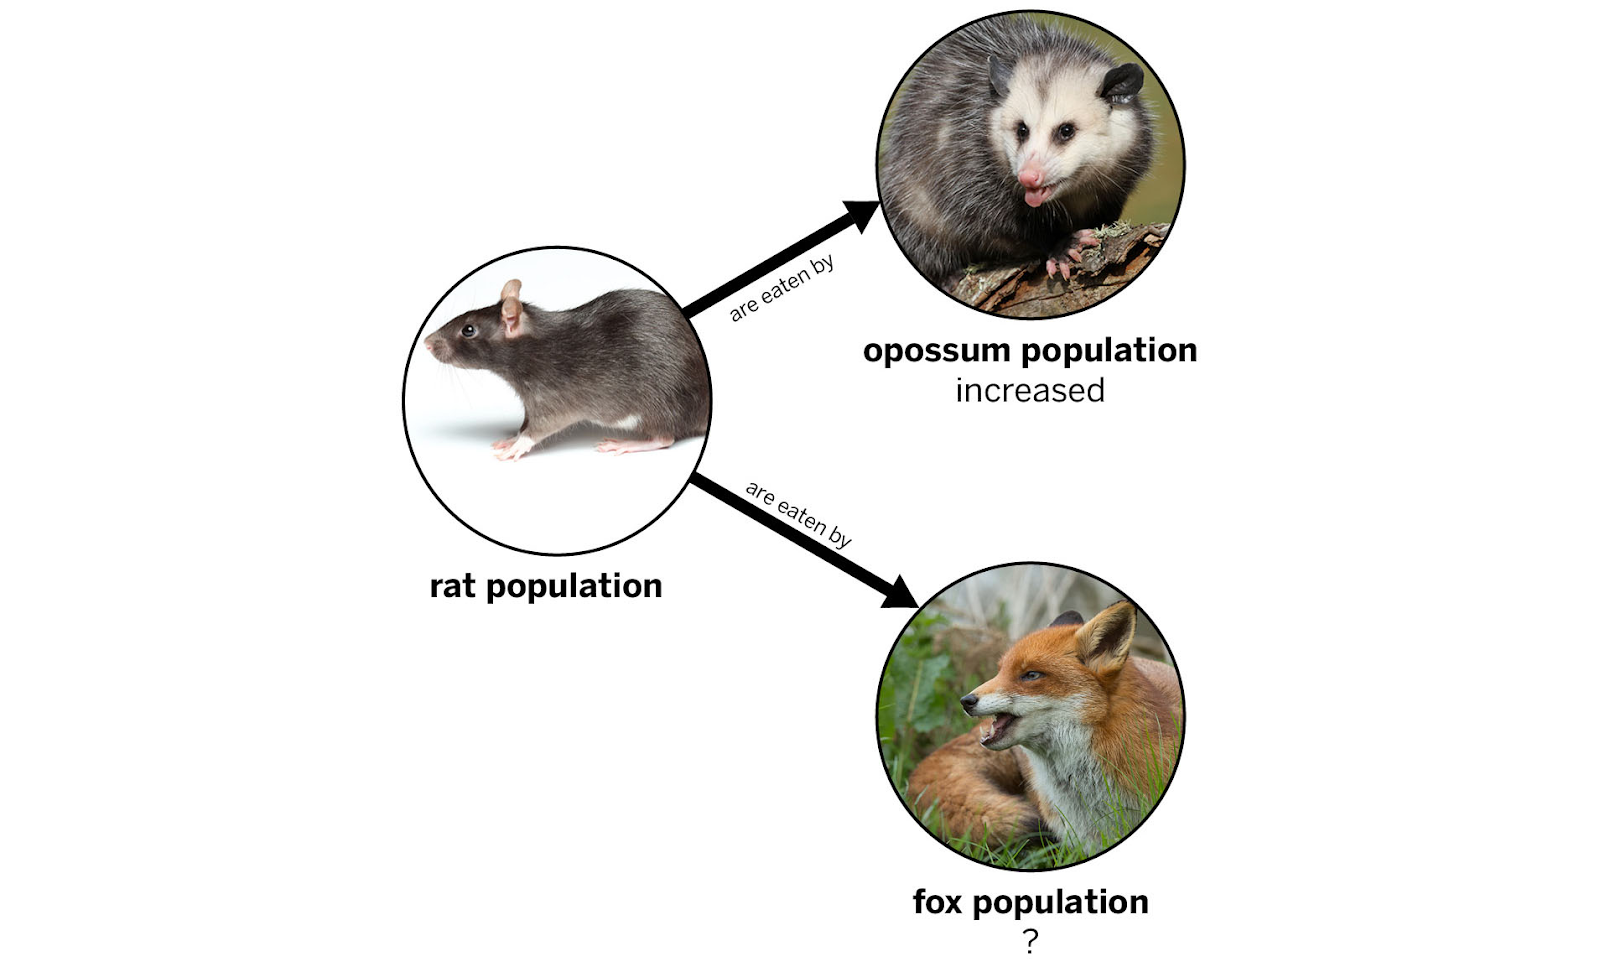
The size of the fox population will . . .
(a) increase. An increase in the size of any population leads to an increase in the sizes of all other populations in an ecosystem.
(b) stay the same. Opossums and foxes do not eat each other, so the number of births and deaths in the fox population will stay the same.
(c) decrease. The larger opossum population will leave fewer energy storage molecules for every population in the ecosystem, so the fox population will reproduce less. This will lead to fewer births than deaths in the fox population.
(d) decrease. Fewer energy storage molecules will be available to the fox population from the smaller rat population, so the fox population will reproduce less. This will lead to fewer births than deaths in the fox population.
(d) decrease. Fewer energy storage molecules will be available to the fox population from the smaller rat population, so the fox population will reproduce less. This will lead to fewer births than deaths in the fox population.
400
Explain the difference between a community and an ecosystem.
A community is a collection of populations living in the same area, while an ecosystem is a community plus the non-living components of the location.
400
Stray cats, mice, and small birds in Bensonhurst all eat food waste left in garbage pails (and in student’s desks). Stray cats also eat mice and small birds. Draw a food web model, labeling, and showing the relationship between the following populations and non-living factors in the Bensonhurst ecosystem:
- mice
- small birds
- stray cats
- human food waste

400
Study the two pieces of evidence below, which show population size estimates of moon jellies based on two different methods of population sample collection.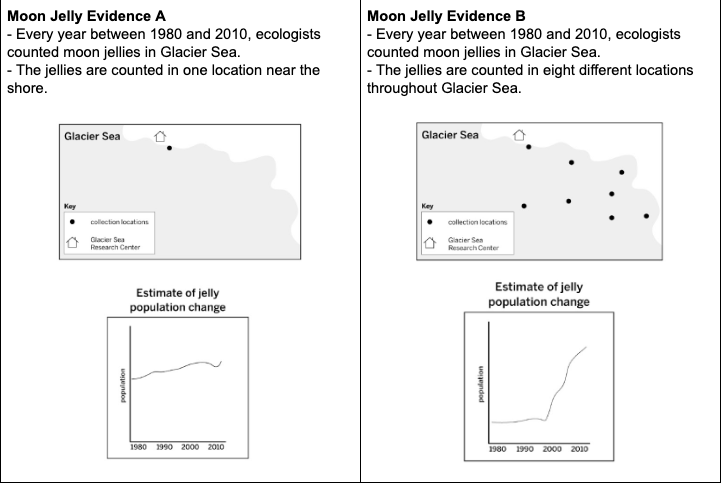
Which of the following statements is true?
(a) Evidence A is not reliable because the line graph of population change does not show a straight line.
(b) Evidence B is not reliable because the line graph of population change shows that the population remained the same and then increased.
(c) Evidence A is reliable because its data is based on a collection site closest to the Glacier Sea Research Center.
(d) Evidence B provides a more reliable estimate of the population size because it collected data at more sites.
(d) Evidence B provides a more reliable estimate of the population size because it collected data at more sites.
500
In the Arctic region, polar bears eat seals, and seals eat cod (a type of fish). In the last 7 years, the sizes of all the populations stayed stable, but recently the size of the polar bear population decreased. What will likely happen to the cod population?

The size of the cod population will . . .
(a) decrease. A decrease in the size of one population leads to a decrease in the sizes of all other populations in an ecosystem.
(b) decrease. The smaller polar bear population will lead to more seals. The larger seal population will need more energy storage molecules to reproduce, so they will eat more cod. This will lead to more deaths than births in the cod population.
(c) stay the same. Polar bears do not eat cod, so the number of births and deaths in the cod population will stay the same.
(d) increase. The smaller polar bear population will leave more energy storage molecules available in the ecosystem for the cod population, so there will be more births in the cod population.
(b) decrease. The smaller polar bear population will lead to more seals. The larger seal population will need more energy storage molecules to reproduce, so they will eat more cod. This will lead to more deaths than births in the cod population.
500
In North America, both bears and eagles eat trout. The sizes of the populations have been stable for the last 9 years, but recently the size of the eagle population decreased. What will likely happen to the bear population?

The size of the bear population will . . .
(a) stay the same. Eagles and bears do not eat each other, so the number of births and deaths in the bear population will stay the same.
(b) increase. The smaller eagle population will leave more energy storage molecules for every population in the ecosystem, so all populations will reproduce more. This will lead to more births in the bear population.
(c) increase. More energy storage molecules will be available to the bear population from the larger trout population, so the bear population will reproduce more. This will lead to more births than deaths in the bear population.
(d) decrease. A decrease in the size of one population leads to a decrease in the sizes of all other populations in an ecosystem.
(c) increase. More energy storage molecules will be available to the bear population from the larger trout population, so the bear population will reproduce more. This will lead to more births than deaths in the bear population.
500
Study the figure below, which depicts the different levels of a biosphere.
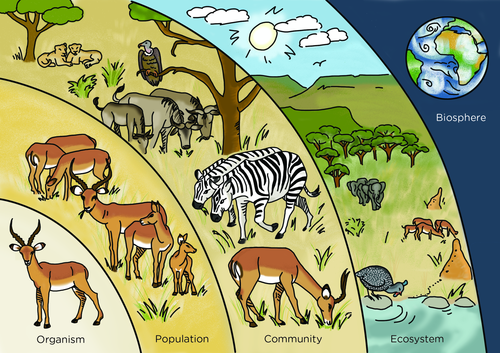
1 2 3 4
Which of the following statements is NOT true?
(a) Level 3 depicts a community because it shows various populations of organisms.
(b) Level 3 depicts an ecosystem because it shows various populations of organisms and the non-living components.
(c) Level 4 depicts an ecosystem because it shows various populations of organisms and the non-living components.
(d) Level 2 depicts a population because it shows a group of organisms of the same species.
(b) Level 3 depicts an ecosystem because it shows various populations of organisms and the non-living components.
500
In full sentences, and using the food web model below, explain how an increase in the human population may have resulted in an increase in the stray cat population of Bensonhurst. Make sure to use the following vocabulary words:
POPULATION
REPRODUCTION
CONSUMER POPULATION
RESOURCE POPULATION
As the human population increased, the amount of food waste also increased. As seen in the food web model, food waste is a source of energy storage molecules for both mice, small birds, and stray cats. As more energy storage molecules are available, organisms will increase their reproduction, resulting in more births than deaths, which will result in a population increase for all 3 populations.
Since the mice and small birds are also a resource population for the stray cats, a consumer population, the stray cat population will also experience an increase in reproduction, because more energy storage molecules will be available to them.
500
Study the two pieces of evidence below, which show population size estimates of moon jellies based on two different methods of population sample collection.
Explain the difference in the line graphs of Evidence A and Evidence B.
The line graphs are derived from data collected in different ways. Evidence A only sampled one collection site while Evidence B sampled eight collection sites. Estimates based on more samples are more reliable.