Decimal Operations
Statistical Questions
Mean, median, mode and range
Dot plots and Histograms
Box and Whisker plots
100
6.325 + 1.230
7.555
100
What is a statistical question?
A statistical question is a question that has different answers. The answers can also be used for data.
100
How do you find the mean of a set of data?
1. Put the numbers in order from least to greatest
2. Add all of the numbers together
3. Divide by the number of numbers in your set
100
What is the difference between a dot plot and a historgram?
A dot plot contains dots to represent its data. A histogram contains bars or intervals to represent its data.
100
What is a box and whisker plot?
A box and whisker plot is another way to gather and visualize your data.
200
8.2 - 3.52369
4.67631
200
Is this question a statistical question, yes or no?
How many pets do you have?
Yes because if I were to ask each of you this question, not everyone would get the same answer.
200
What is the mean?
8,3,2,5,9,10,4,2,1,7,8
5.36
200
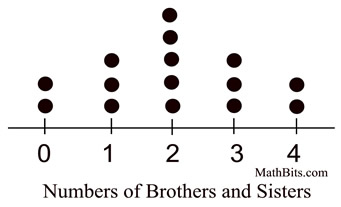
How many people were surveyed?
15
200
What is the Q1 of this set of data?
4,6,9,10,15,20,22,23,25
7.5
300
8.2145 divided by 9.24512
0.88852281
300
Is this question a statistical question, yes or no?
How many states do we have in the United States?
No because if I were to ask each of you how many states were in the United States, each of you would say the same answer.
300
What is the median?
2,5,7,9,20,35,40
9
300
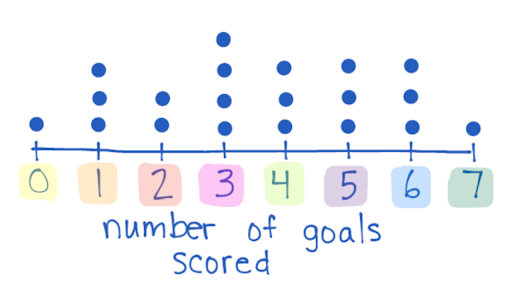
How many people scored at least 3 goals?
14
300
What is the Q2 of this set of data?
5,8,9,10,11,13,16,17,19,20
12
400
2136.5 x 652.213
1,393,453.07
400
What is a non-statistical question?
A non-statistical question is a question that can only get one answer no matter how many times it is asked.
400
What is the mode and the range?
1,3,3,3,5,7,9,10,10,11,15
Mode is 3 and 10
Range is 14
400
In which interval does the median fall?
3
400
What is the Q3 of this set of data?
7,4,5,2,1,15,4,5,18,20
15
500
Why are your key words in math important?
They help you understand which operation you will be doing while working with decimal operations.
500
Is this question a statistical question, yes or no?
How many people in the office are wearing a tie?
No because if I were to ask each of you how many people in the office are wearing a tie, you all would tell me the same answer.
500
How do you find the mode, range, and median?
Mode= put them in order from least to greatest, find the number that is listed more than once. You can 1,2, or no mode
Range= put them in order from least to greatest, subtract the biggest number and the smallest number
Median= put them order from least to greatest, find your middle number. If there is more than one number in the middle, add them and divide by 2.
500
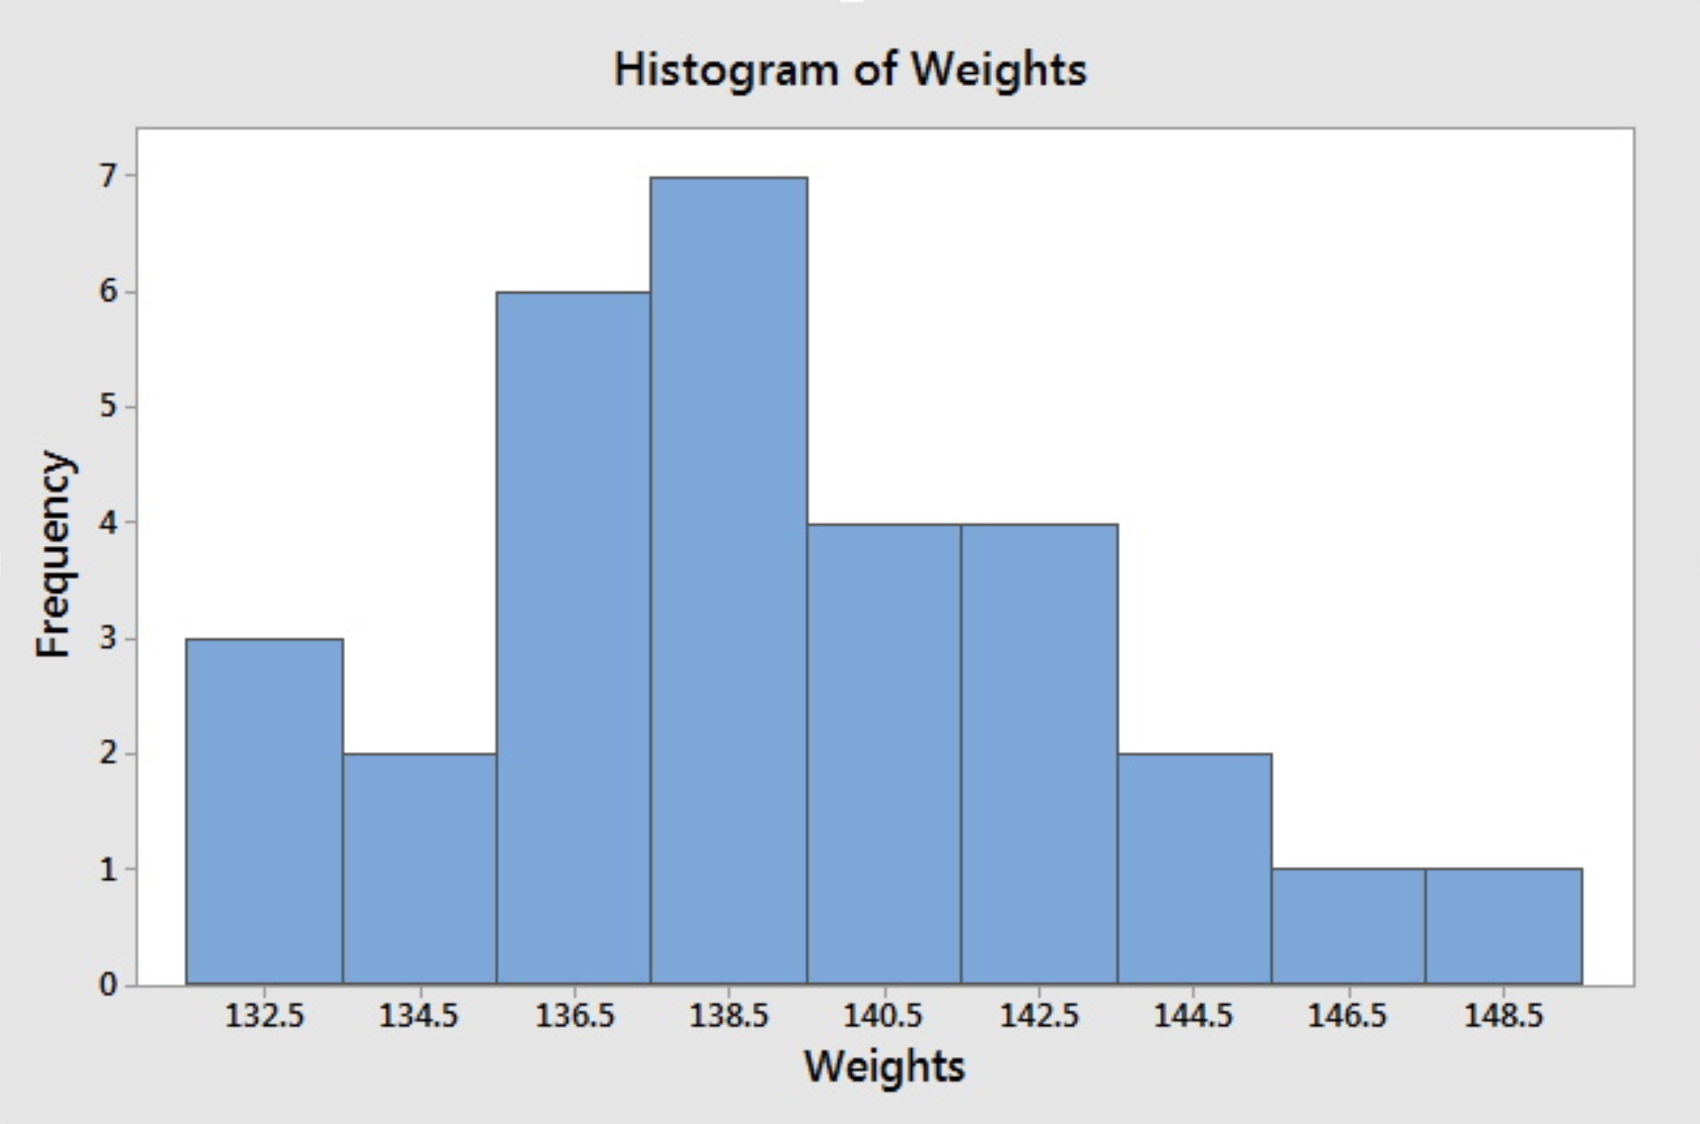
In which interval does the median fall?
138.5
500
What is the interquartile range of this data set?
4,5,7,8,9,10,15,18,19,20,22,25,27,29,30
17