Indicate which graph has a positive, negative, and no apparent relationship.


P (A|B) = P (A∩B)
P (B)

What is conditional probability.
Numerical factors such as averages, medians, percentages, and maximums that help us understand a variety of business and economic situations.
What is statistics?
The tabular summary of data showing the number of observations in each of several nonoverlapping categories or classes.
What is a frequency distribution?
§A six-sided die is rolled. What is the probability of landing on a 5?
§What is 1/6?
What is sample mean.
Facts and figures collected, analyzed, and summarized for presentation and interpretation.
What is data?
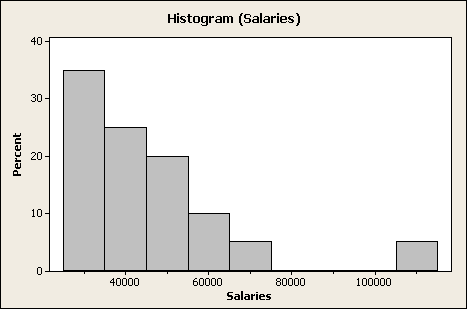
 The skew of this histogram
What is skewed right?
§Please explain the process of how to construct a scatter plot. Make sure that you include all points of a graph.
§Title
§X-axis title
§Y-axis title
§Numerical values for x and y
§Dots corresponding to the x and y data values.
What is a graphical display for depicting qualitative data.
Var (x) = σ2 = E(x - μ)2f(x)
What is variance of a discrete random variable.
A subset of a population.
What is a sample?
What are the 5 graphical and tabular displays used to describe Categorical data?
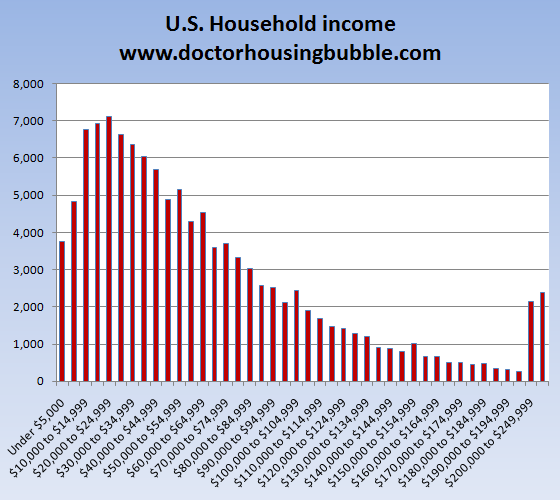
Describe the shape of this curve:

Skewed Right or Positively Skewed.
What is one value of the second variable.
What is hypergeometric probability function.
The population we want to make inferences about.
What is a target population?
The tabular display that shows the percentage of data items with values less than or equal to the upper limit of each class for quantitative data?
What is a Cumulative Percent Frequency Distribution?
§One of the most common statistics worldwide is a periodic count of the population. What is this known as?
What is census
What is a commonly used graphical display for presenting relative frequency and percent frequency distributions for categorical data.
The 8 graphical and tabular displays used to describe quantitative data?
Frequency Distributions
Relative Frequency Distributions
Percent Frequency Distributions
Dot Plots
Histograms
Cumulative Frequency Distributions
Cumulative Relative Frequency Distributions
Cumulative Percent Frequency Distributions
A numerical description of the outcome of an experiment.
What is a random variable?
The 8 graphical and tabular displays used to describe quantitative data?
1.Frequency Distributions
2. Relative Frequency Distributions
3.Percent Frequency Distributions
4.Dot Plots
5.Histograms
6.Cumulative Frequency Distributions
7.Cumulative Relative Frequency Distributions
8. Cumulative Percent Frequency Distributions
§John has thirty socks in total disorder in his draw. Ten are green, ten are white and ten are orange, but John can't distinguish the colors in the dark. How many socks does he have to take to be sure he has at least one pair of the same color?
What is 4


