Scatter Plots
Linear Relationships
Systems of Equations
slope
100
What does a scatter plot tell you?
How one variable is affected by another.
100
True or false linear relationships can not start anywhere on graph
False
100
x + y = -3
y = x + 3
What is (-3, 0)
100
what is the slope?
4=2x+10
2
200
What three types of scatter plots on there?
Positive, Negative, and non
200
what is the equation for linear equations
y=mx+b
200
y = 2x y = x + 1
What is (1,2)
200
(2,3) and (9,7)
m=4/5
300
What one job mostly using scatter plots?
Economist
300
in the equation y=mx+b what is b and what is mx
b is you y intercept and mx is your slope
300
y = 3x y -4 =3x
What is no solution
300
which number is slope
y-3=-8(x+4)
m=-8
400
What is the correlations of the scatter plots?
Variables
400
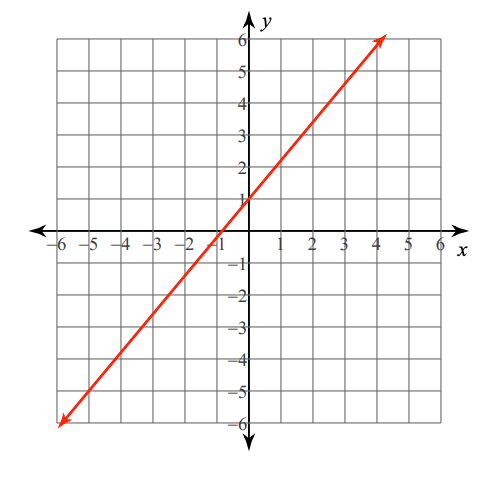
is y=-5x+b linear?
yes
400
y=-2x
x = 0
What is (0, 0)
400
6/5
500
What makes a good scatter plot?
Data points
500
is y=^+b linear?
No
500
y = 1/4 x x + 4y = 8
What is (4, 1)
500
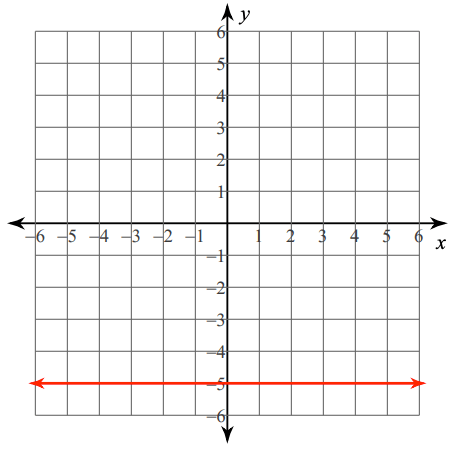
m=0