Area & Perimeter
Histograms
Rounding Decimals
Dot Patterns
Ordering Decimals
100
What is the area of the shape shown below:

Area: 8 units2
100
The histogram displays the amount of snowfall recorded in Urbana, IL over the years.
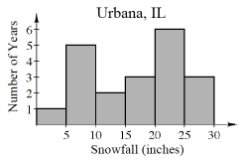
Which range of snowfall measurements occurred most often?
What is 20-25 inches?
100
Round each decimal to the place value specified:
243.51 (ones)
What is 244?
100
Use the dot pattern shown below to answer the question:
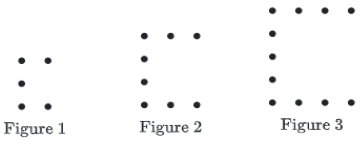
How many dots are in Figure 1?
What is 5?
100
Which decimal is greater?
0.9 or 0.09
0.9
200
What is the perimeter of the shape shown below:

Perimeter: 14 units
200
The histogram displays the amount of snowfall recorded in Urbana, IL over the years.

For how many years did they collect data on snowfall in Urbana?
What is 20?
200
Round each decimal to the place value specified:
243.51 (tenths)
What is 243.5?
200
Use the dot pattern shown below to answer the question:
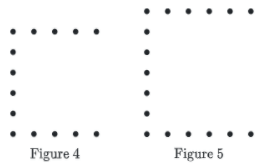
Draw the 4th and 5th figure of this dot pattern.
200
Order the following decimals from least to greatest:
12.1 13.4 12.5
12.1 12.5 13.4
300
What is the area of the shape shown below:
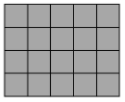
Area: 20 units2
300
The histogram displays the amount of snowfall recorded in Urbana, IL over the years.
Can you tell by looking at the graph exactly how many inches of snow there was in the year represented in the first bin? If so, how much snow fell that year? If not, why can't you tell?
What is "No." A histogram does not give provide you with exact data. It only give ranges.
300
Round each decimal to the place value specified:
42.056 (hundredths)
What is 42.06?
300
Use the dot pattern shown below to answer the questions:
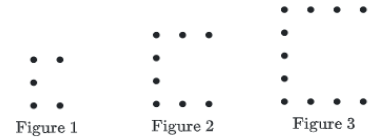
How do you see the shape growing? Be specific?
Three dots are being added every time. A dot is being added to the left column and one is also being added to the top and bottom row.
300
Order the following decimals from least to greatest:
0.21 0.192 0.201
0.192 0.201 0.21
400
What is the perimeter of the shape shown below:
Perimeter: 18 units
400
The histogram displays the amount of snowfall recorded in Urbana, IL over the years.
Were there any years with unusually large or small amounts of snowfall? If so, which range(s) would you say? Why?
What is "Yes." One year it only snowed between 1-5 inches which is not a lot of snow. Since this only happened one year, it is not typical.
400
Round each decimal to the place value specified:
187.23 (tens)
What is 190?
400
Use the dot pattern shown below to answer the questions:
Make a prediction for how many dots there would be in the 10th figure.
What is 32 dots?
400
Order the following decimals from least to greatest:
6.5 6.498 6.05 6.52 6.502
6.498 6.05 6.5 6.502 6.52
500
What is the area and perimeter of the shape shown below:
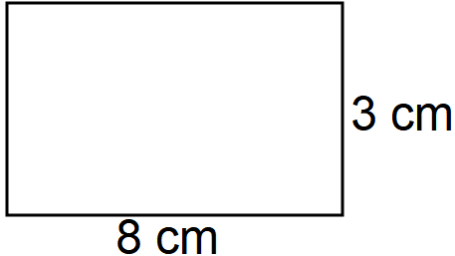
Area: 24 cm2
Perimeter: 22 cm
500
The histogram displays the amount of snowfall recorded in Urbana, IL over the years.
Half of the years had snowfall amounts at or above how many inches?
What is 15?
500
Round each decimal to the place value specified:
198.897 (hundredths)
What is 198.9?
500
Use the dot pattern shown below to answer the questions:
Explain a general rule for how you can make a prediction for the amount of dots in ANY FIGURE.
Answers vary:
If you know the figure number, you can multiply it times 3 and then add 2 since Figure 1 starts with 5 dots.
You can take the figure number minus 1 and multiply that by 3 and then add on the original 5 dots.
500
Order the following decimals from least to greatest:
123.19 124.01 123.2 123.024 123.125
123.024 123.125 123.19 123.2 124.01