Organizing Data
Displaying Data
Numerical Summaries for Quantitative Data
Random
All about Mrs. V
100
This type of data assigns a label that places each individual into one of several groups, such as male or female.
Categorical Data
100
In a right skewed distribution, which value will be smaller, mean or median?
median
order: mode, median, mean
100
How do you calculate the IQR?
Q3-Q1
100
Find the IQR for the following distribution.
3
100
What college did I get my Bachelor's degree at?
Cal Poly Pomona
200
__________ is who or what we are obtaining the data from.
Individuals.
200
You can use a dotplot, stemplot, or histogram to show the distribution of a _____________ variable.
Quantitative
200
The five number summary for a box plot include:
Minimum, Q1, Q2, Q3, Max
200
Which box plot has the smallest IQR?
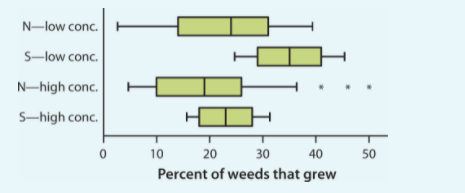
S-high concentration
200
What is Mrs. V's dog's name?
hint: (mexican candy name)
Duvalin
300
The following are examples of which type of data?
age, scores on a test, number of siblings, number of concerts attended
Quantitative
300
What are the four ways you can describe a distribution?
Shape
Center
Variability
Outliers
300
How much of the data is below Q3?
75 percent ( 3/4 of the data)
300
The bar chart represents how much money each of of 136 students have in their possession. In what interval is the median located? is the median located?
The median is located between $10-$20.
300
How old is my oldest cat?
11
400
Give 4 examples of Categorical Data.
Answer varies.
400
Which of the following distribution has a smaller standard deviation? Blue or Orange bar chart?

Blue
400
Which measure of center and variability are not resistant to outliers?
hint: there are 3, if you answer 2/3 you get the points.
mean, standard deviation, and range
400
What percentage of data points are greater than 42?

20%
400
I won free ________ for a year.
Canes
500
What type of variable is the following?
Scores on a test between:
0-50
51-100
Categorical
500
In a statistics class with 136 students, the professor records how much money (in dollars) each student has in his or her possession during the first class of the semester. The histogram shows the data that were collected.

C) approximately 45%
500
Is there any lower outliers in the following data set?
A summary statistics is provided. 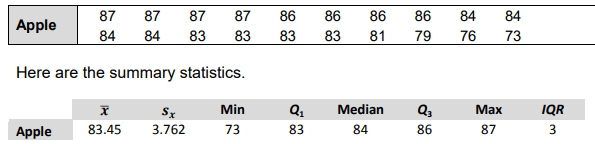
Yes 73 and 76 are low outliers.
500
Find the five summary for Brand Y.
Min=17
Q1=42
Q2=43
Q3=45
Max=50
500
My favorite band is ___________.
Chicano Batman