Lab Safety & Length & Mass
Branches of Science
Mean Median Mode and Range
Density
Graphing
100
Name one way to stay safe when using fire in the laboratory!
Tie up hair
remove long sleeve jackets
Use tongs to grab material in flames/never use bare hands to touch hot objects
Turn off flame when not in use
100
True or false: all the branches of earth science interact with each other
True
100
Find the mean of this data set
45, 32, 100, 78, 57
62.4
100
What is the formula for density?
Density = mass/volume
100
What kind of graph is the following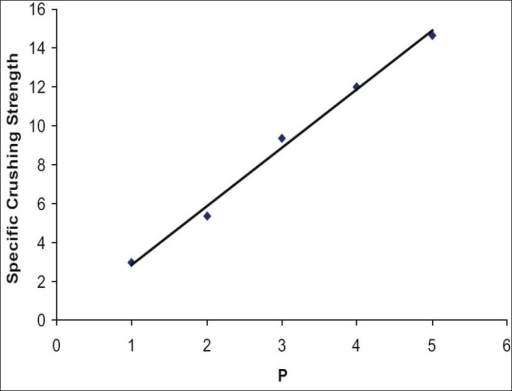
Line Graph
200
Demonstrate the proper way to smell chemicals
200
What is Life Science?
The study of living things.
200
Find the median of this data set
45, 32, 100, 78, 57
57
200
Which liquid is the LEAST dense?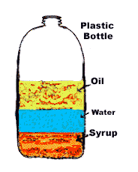
The oil
200
What does a pie graph depict?
Percentages!
300
What is the mass on this triple beam balance?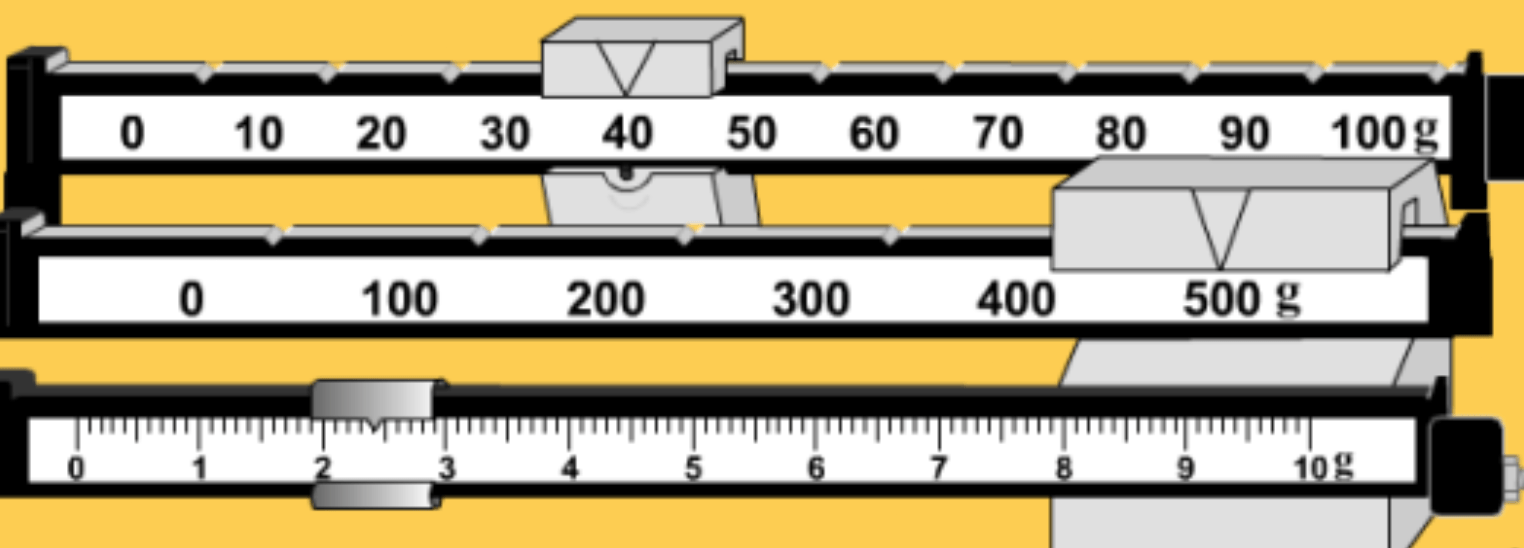
542.4 g
300
What is Earth Science?
The study of rocks, minerals, weather and space
300
Find the mode of this data set
45, 32, 100, 78, 57
None
300
Solve for density. Jayleen has a rock. The rock has a mass of 14 g and a volume of 2 cm3. What is the density of the rock?
7 g/cm2
300
What is an inference?
A conclusion reached on the basis of evidence and reasoning.
400
Convert this number into Meters (m)
2347mm (Hint: what do you divide by?)
2.347 m
400
What is Physical Science?
The study of inanimate natural objects, including physics, chemistry, astronomy, and related subjects
400
Find the range of this data set
45, 32, 100, 78, 57
68
400
Solve for mass. If Elijah has a backpack that has a density of 45 g/cm2 and has a volume of 38 cm2, Whats the mass?
1710g
400
What can we infer about this graph!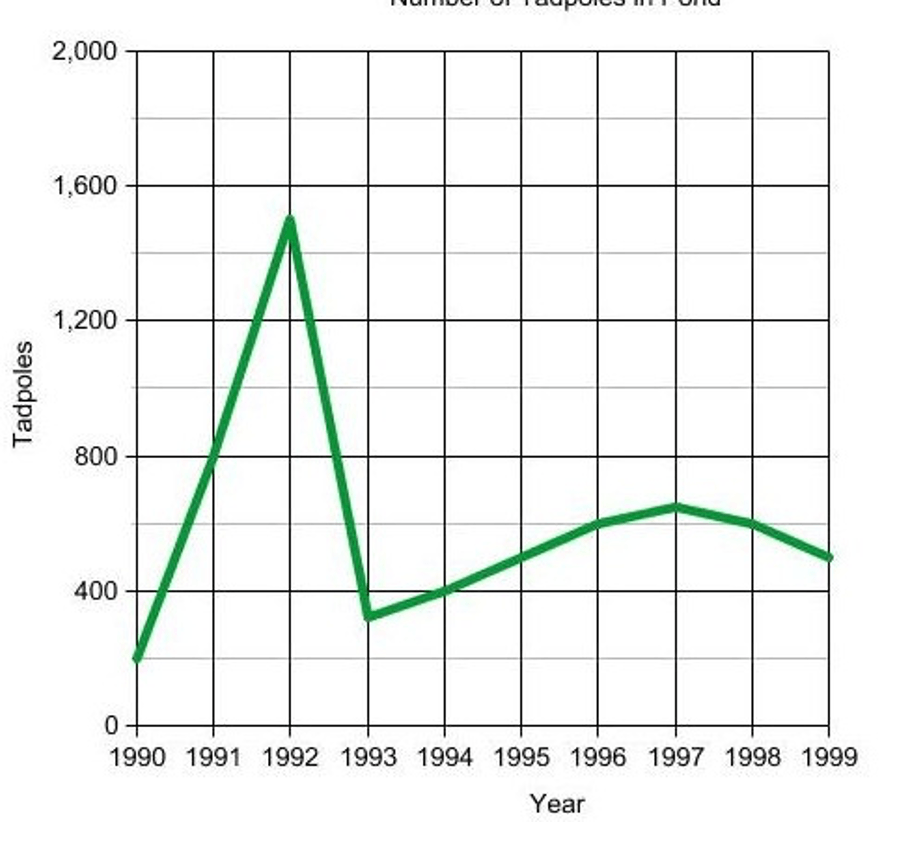
Answers may vary
500
What is the most important rule of the laboratory?
Always listen to your teacher!
500
What is Meteorology?
The branch of science that deals with atmospheric conditions and forecasting weather
500
What is an outlier?
The number that doesn't seem to belong
500
If temperature increases, what happens to the density?
It decreases
500
What can we infer about this graph?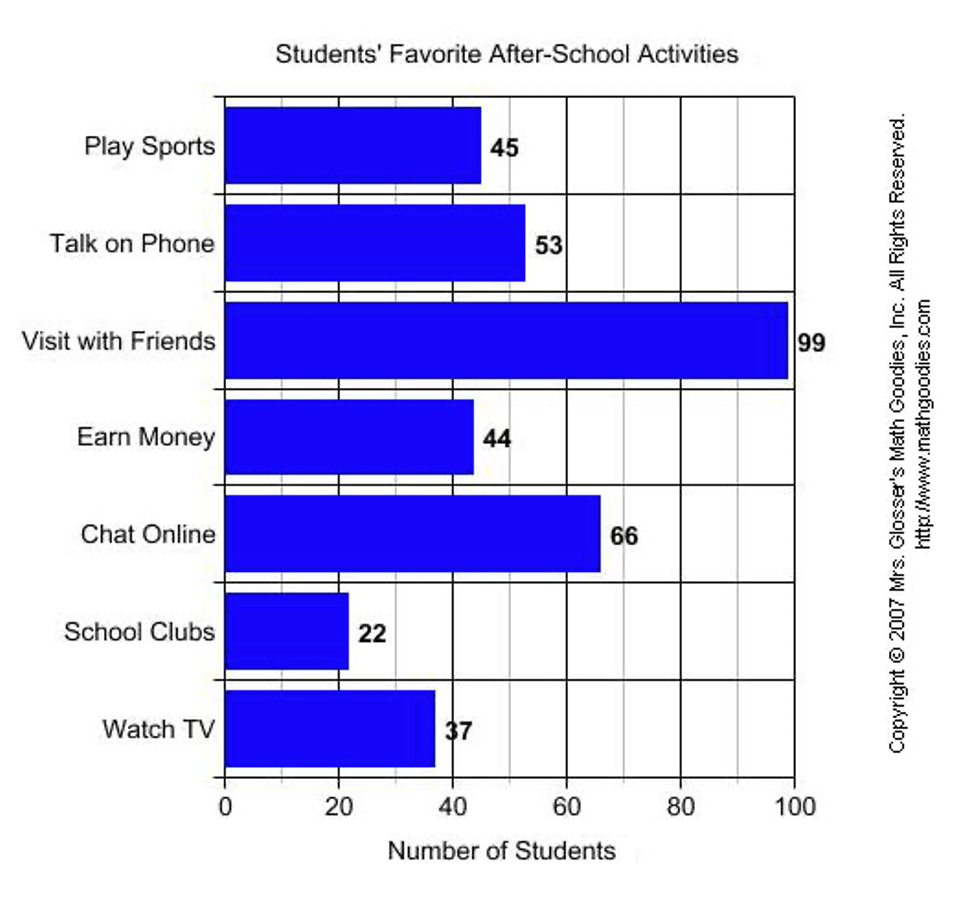
Answers may vary