Vocabulary
Box Plots
Histograms
100
A modified segmented bar graph in which the width of each rectangle is proportional to the number of individuals in the corresponding category.
What is a Mosaic Plot?
100
Minimum, Q1, Median, Q3, Maximum
What is the Five Number Summary?
100
Gaps in a histogram are what?
What is "gaps in data"
200
Tells what values a variable takes and how often it takes these values.
What is a Distribution?
200
Another name for the median.
What is Quartile 2?
200
Histograms are used for what kind of data.
What is quantitative data.
300
An association between two variables that holds for each value of a third variable can be changed or even reversed when the data for all values of the third variable are combined.
What is Simpson's Paradox?
300
The shape is

What is skewed right
300
The 3 key elements to describe the distribution of a histogram.
What is "shape, center and spread"
400
A statistical measure that isn't sensitive to extreme values.
What is a Resistant measure?
400
The percent of students who spend an hour of time on homework per night.
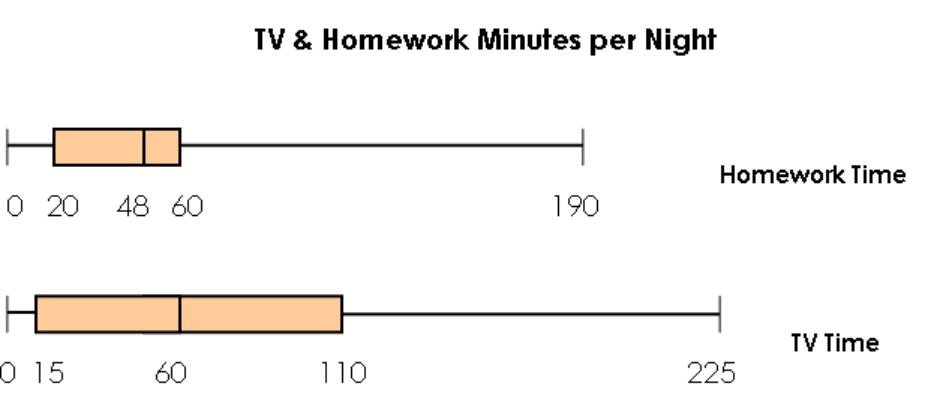
What is 75%?
400
If a histogram has a tail that stretches farther than the other, the histogram is said to be.
What is "skewed"
500
"Average" squared deviation of the values in a distribution from their mean.
What is Variance?
500
The IQR describes what percent of values?
What is the "middle 50%"?
500
The total number of black cherry trees
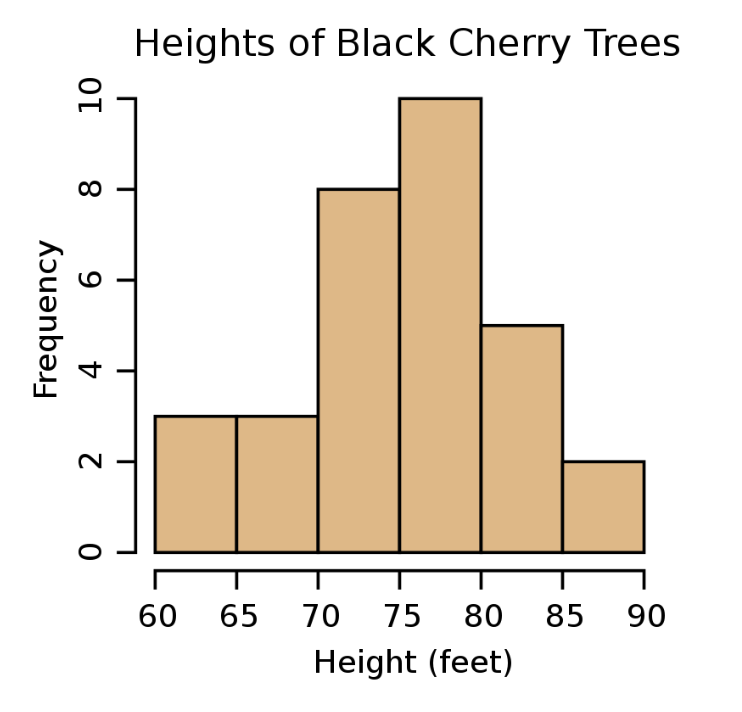
What is 31?