Boxplots
Frequency Tables
Types of Graphs
Mean, Median, Mode, Range, Deviation
100
What is the median and range?

Median=9. Range=10.
100
How many people have no food and no drink.

10 people
100
How many people have 3 or more siblings?
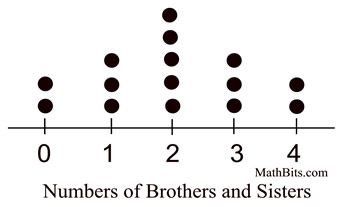
5
100
What is the outlier?
2, 3, 4, 4, 6, 27, 7, 8
27
200
How much of the data is in between the 3rd Quartile and the maximum?
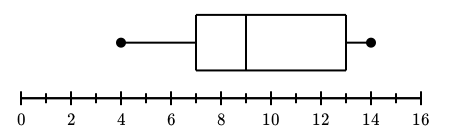
25%
200
How many people ordered pizza and soda?
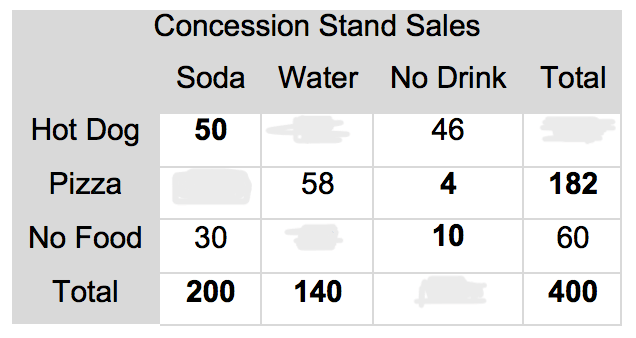
120 people
200
Write a list of numbers from this stem-and-leaf plot.
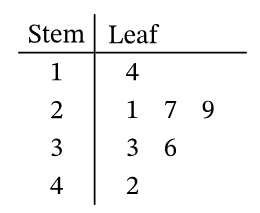
14, 21, 27, 29, 33, 36, 42
200
What is the range?
5, 8, 19, 3, 24, 15, 16, 16, 28
28-3=25
300
Left skewed, right skewed, or symmetrical? 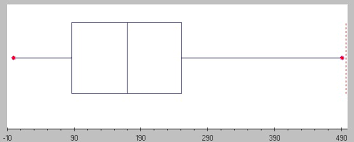
Right skewed
300
How many total people ordered pizza?

182 people
300
Which graph is a bar graph and which is a histogram? What are 2 differences?
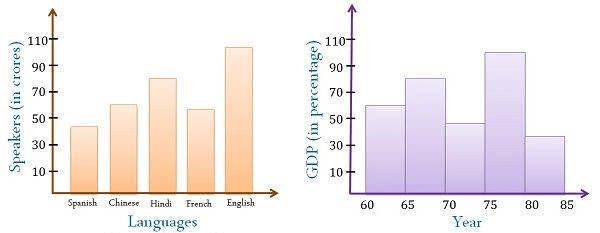
Left is a bar graph (has categories and the bars are spaced out. Right is a histogram (has # frequencies and the bars are not spaced out.)
300
Find the median.
2, 6, 8, 21, 17, 3
In between 6 and 8; so it is 7.
(6+8)/2=7
400
What is the 5-number summary?
Minimum, Maximum, Median, Upper Quartile, Lower Quartile
400
What percent of people ordered pizza and no drink?
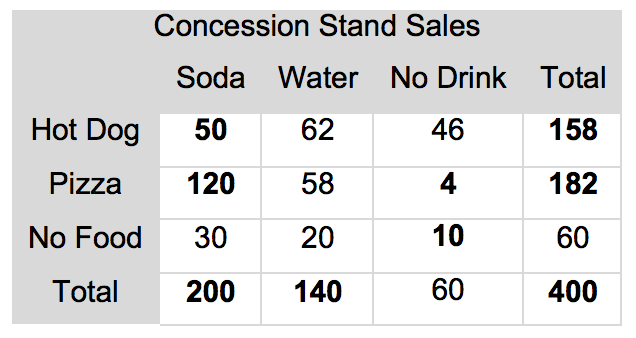
4/400=0.01=1%
400
Is the histogram left skewed, right skewed, or symmetric?
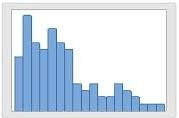
Right Skewed
400
What is the mode? Can there be more than one mode?
Number that appears the most. There can be more than one.
500
What does IQR stand for? How much of the data does it contain?

Interquartile range=box=middle 50% of the data.
500
What percent of people ordered water? 
140/400=0.35=35%
500
Is this dot plot unimodal or bimodal?
Is it left skewed, right skewed, or symmetrical?
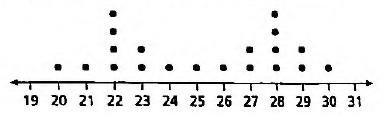
Bimodal (has two peaks). Symmetrical.
500
Find the mean.
2, 3, 5, 7, 8, 8, 9
2+3+5+7+8+8+9 = 42÷7= 6