Population and Samples
Dot Plots
Box Plots
Comparing Plots
No Calculator
100
An entire group of objects, individuals, or events is a _____________.
What is Population
100
In the following dot plots, what is the most common length? 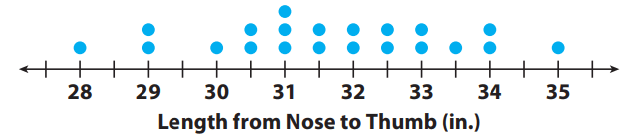
What is 31 in.
100
What is the median of the following box plot?
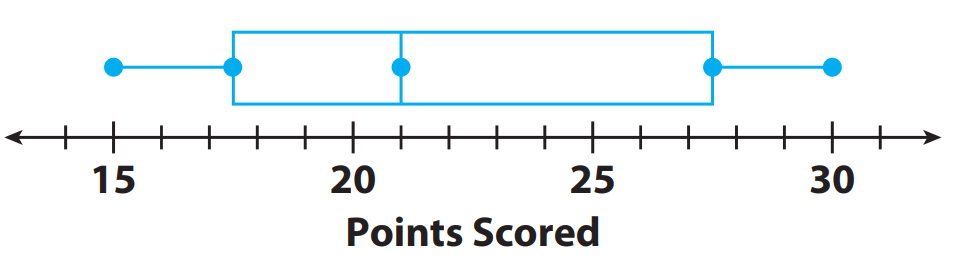
What is 21 points.
100
Which dot plot is more symmetrical? Top or bottom? 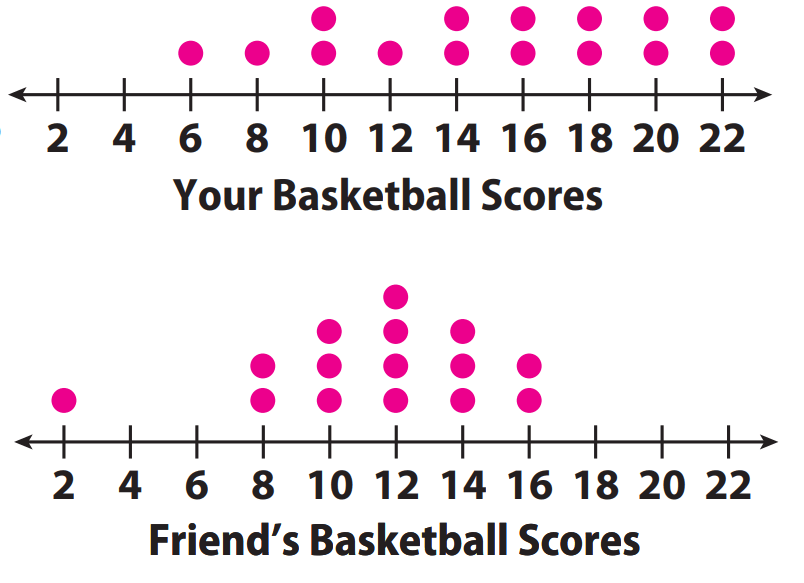
What is the top plot.
100
What is
(1/4)/(2/5)
What is
5/8
200
Melanie wants to know if people like pets in the house. She asks the question, "Do you like dogs in your house?". Is the questions biased or unbiased?
What is biased.
200
In the following dot plots, what is the range? 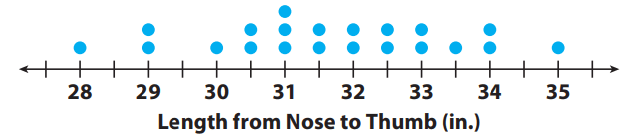
What is 7.
200
What is the minimum and maximum value in the box plot? 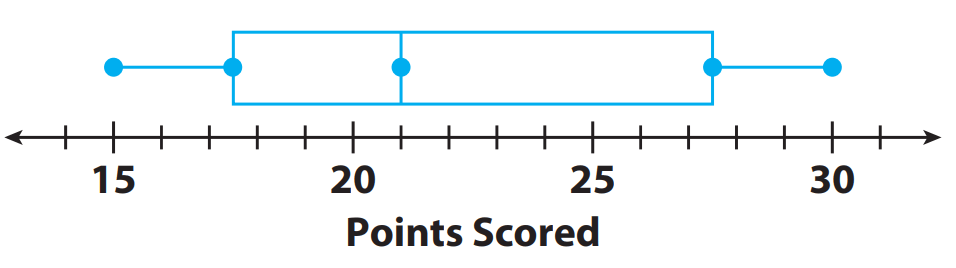
What are 17.5 and 22.5.
200
What are the two medians of the box plots below? 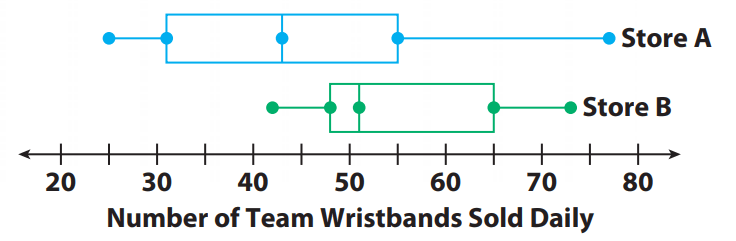
What are 43 and 51 (about).
200
A person traveled for 1/6 hours a total of 2/3 miles. What is the unit rate in miles per hour.
What is 4 miles per hour.
300
Roberto wants to know the favorite sport of adults in his hometown. He surveys 50 adults at a baseball game. Is this sample biased or unbiased?
What is biased.
300
In the following dot, describe the center. 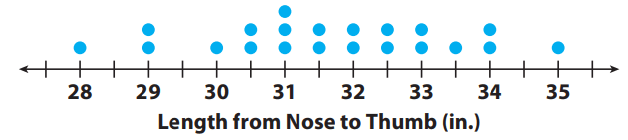
What is 31 inches.
300
What percent of the data is between Q1 and Q3? 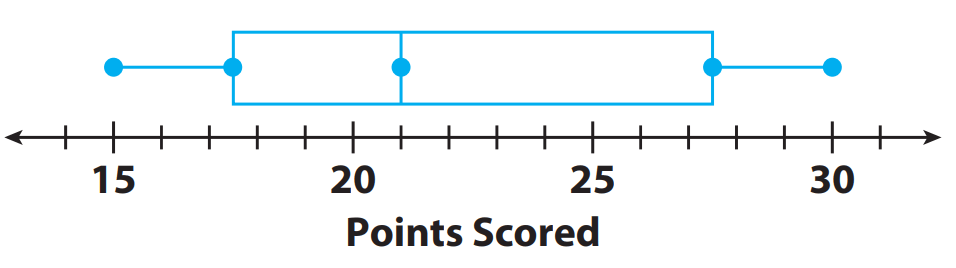
What is 50% of the data.
300
What is the difference of the ranges?
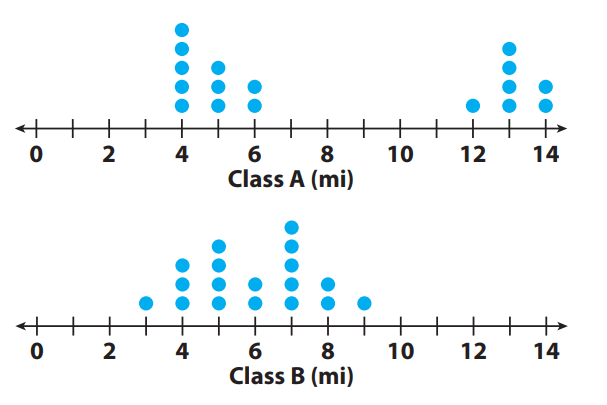
What is 4.
300
Divide
6/(2/5)
What is 15.
400
The mayor uses a random sample to estimate the average number of workers per block. She picks the following numbers out of 25:
56, 60, 50, 43, 62, 53
What is 54.
400
In the following dot plot, what is the outlier? 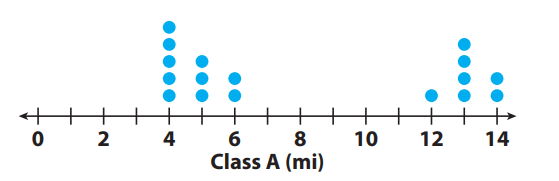
What is there is no outlier.
400
What is the Interquartile Range? 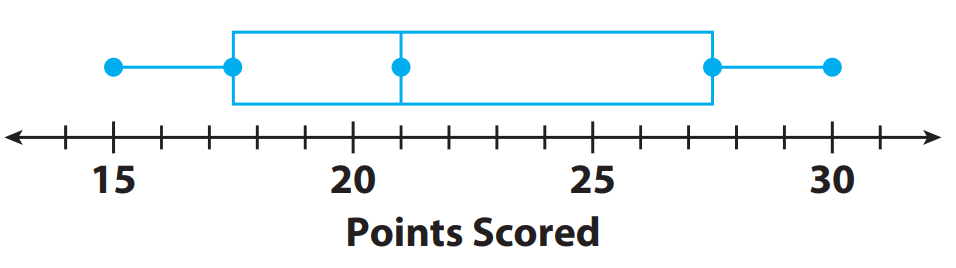
What is 5.
400
Which graph has a greater Q3? 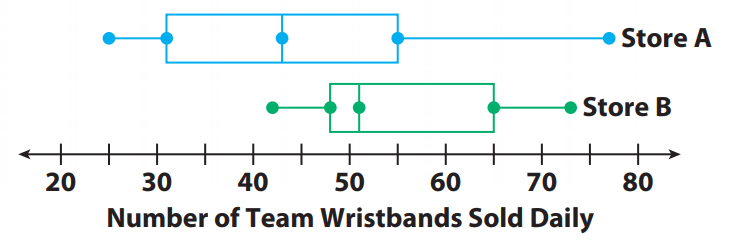
What is Store B.
400
Are the following set of data points proportional?
(2, 5), (3, 7.5), (4, 10), (5, 12.5)
What is yes.
500
A university has 30,330 students. In a random sample of 270 students, 18 speak three or more languages. Predict the number of students at the university who speak three or more languages.
What is 2,022 students
500
Calculate the mean for the following dot plot.
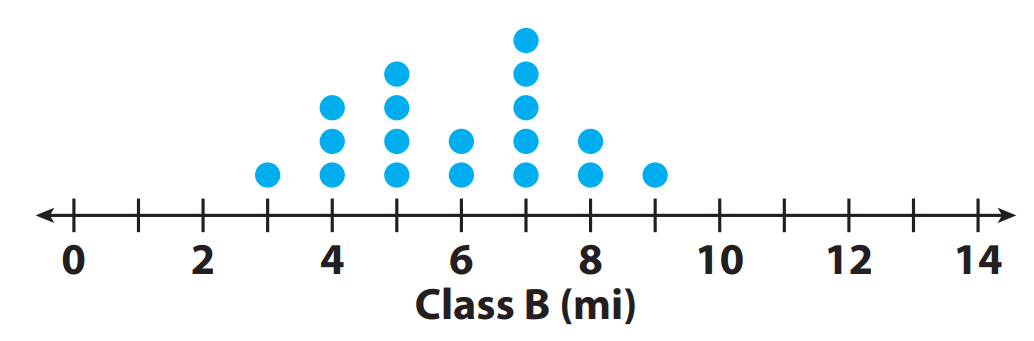
What is about 6 mi (5.94 mi).
500
What is the difference between the median and the range? 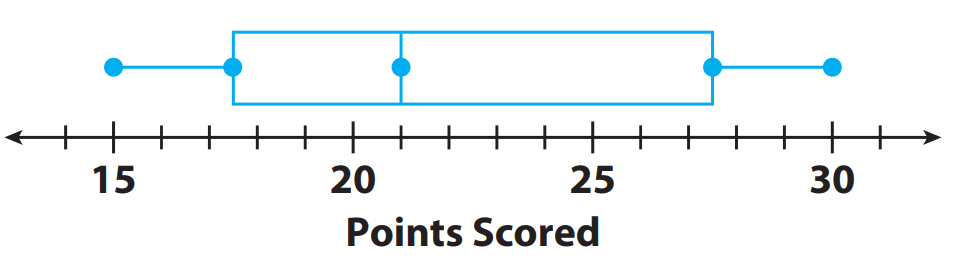
What is 6.
500
The IQRs for both graph is 10. TRUE or FALSE. The difference between the medians is exactly half the IQR. 
What is false.
500
What is the equation in terms of x and y for the following data points.
(3, 18), (4, 24), (10, 60), (12, 72)
What is y = 6x