Sampling
Dot Plots
Box and Whisker
Mean, Median, Mode, Range
Vocab
100
Is this sample biased or unbiased?
Kelsey wants to know what cookie flavor is most popular. She surveys every 5th person who walks into a grocery store.
Unbiased
100

What is the MODE of this dotplot?
10
100
How do we find
1. Range?
2. IQR?
Range= Max-min
IQR= 3rd quartile-1st quartile
100
Find the mean of the following data set
1,5,8,10,15,19,22,46
15.75
100
Define "biased" is terms of how we have used it this unit
An unfair sample that favors something
200
Write the population and sample from the scenario below
Paulette wants to know the average temperature across all states in the US. She measures the temperature of each state capital.
Population: States in US
Sample: State capitals (city)
200
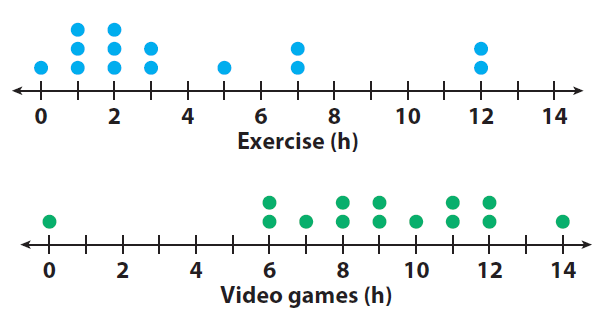
Fill in the blank: There is a __________ overlap between the dot plots
Small
200

True or False: The median of the 2006 games is greater than the median of the 2010 games
FALSE
200
Find the mode and range of the following data set
1,1,1,1,2,2,2,3,4,6,7,9,14,12,15,16,18
Mode: 1
Range: 17 (18-1)
200
Describe sample and population
Population is general, sample is specific
300
Imagine you are conducting a survey to assess the satisfaction levels of residents in a city park. Create a fair, unbiased survey
*depends on asnwer*
300

Describe the SHAPE of the dot plot
Skewed left
300

Find the mean of Team A and the IQR of Team B
Team A MEAN: Cannot be determined
Team B IQR: 10 (60-50)
300
Find the median of the following data set
2,1,12,4,5,7,7,8,9,10,12
7
300
What words should we think/what are other words for...
Mean:
Median:
Mode:
(IN ORDER)
Average
Middle #
Most (occurring) #