Life Science
Graphing and Data
Earth & Space Science
Physics Concepts
Chemistry Concepts
6th Grade Knowledge
100
What part of the cell contains DNA and controls most cell activities?
The Nucleus
100
A graph showing the populations of lemmings and weasels in a given environment over a nine-year period is shown. How many more lemmings are there than weasels during the peak of the lemmings' population?
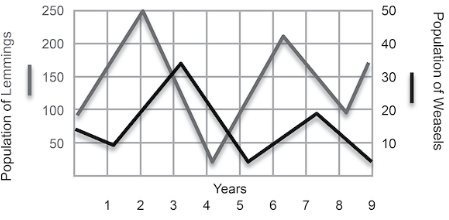
150
100
What are the three main types of rocks in the rock cycle?
Igneous, sedimentary, and metamorphic
100
What force attracts objects with mass toward each other?
Gravity
100
What are the basic building blocks of all matter?
Atoms
100
What is the term for water changing from a liquid to a gas?
Evaporation
200
What process do cells use to break down glucose and release energy?
Cellular Respiration
200
The table provides information on population density of mayflies, a kind of insect, in a certain area over a few years.
Which year provides evidence that there was a significant increase in the population of birds that prey on mayflies?
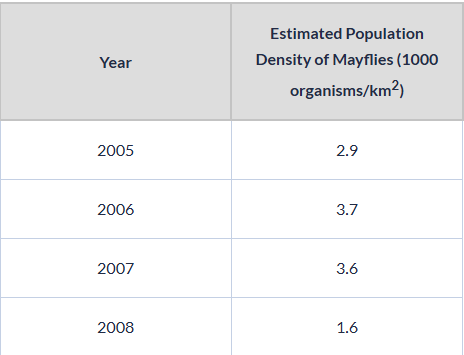
2008
200
What is responsible for Earth's seasons?
The tilt of Earth's axis as it orbits the sun
200
The law that states: "For every action, there is an equal yet opposite reaction"?
Newton's Third Law of Motion
200
What are the three main subatomic particles in an atom?
Protons, neutrons, and electrons
200
Describe a way in which scientists can determine if a newly discovered object should be classified as living or nonliving.
Examine to see if there is a presence or absence of cells.
300
What do similar patterns of embryonic development among different species suggest?
They share a common ancestor
300
The table shows areas where sedimentary rock layers are exposed, as well as the environmental factors that produced the rock layers.
Coal forms in locations where vegetation gets buried quickly, and then altered by heat and pressure over millions of years. Which location is most likely to have coal?
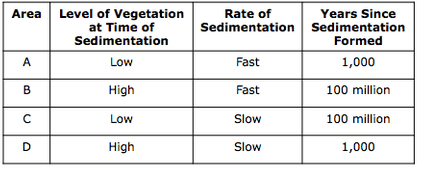
Area B
300
Satellite photos of the same beach from 2 different years are provided below. The point of sand indicated with an arrow has shifted due to wave action. If similar rates of erosion and deposition occur, where would you expect the point of sand to be located in 2015?
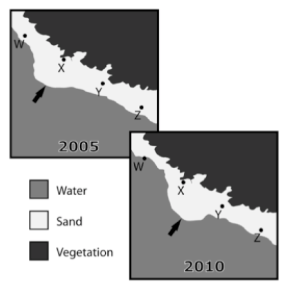
Point Y
300
Describe how the force between two charged objects changes as the objects move closer to each other.
As two charged objects move closer to each other, the force between the objects increases.
300
How does adding thermal energy to solid ice affect the molecules in the ice?
Changing from solid to liquid - the particles spread out and move faster
KE is increased
300
Describe the differences between plant and animal cells.
Plants have cell wall, animal cells do not
400
Identify 3 biotic factors fish in a small pond depend on to meet their needs.
Plants that exchange oxygen
small insects/organisms for food
plants for shelter/protection
400
The graphs show how two factors for a certain region changed over time: the number of predators that prey on mice and number of plants of the type that the mice eat.
Based on the information, which of the following years would the population of mice been the highest?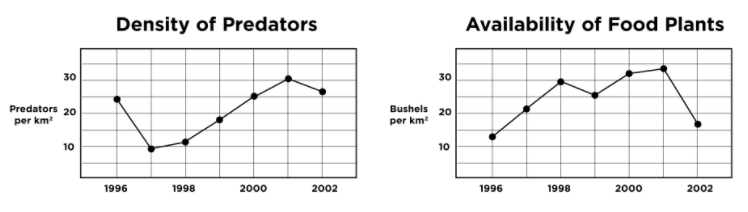
1998
400
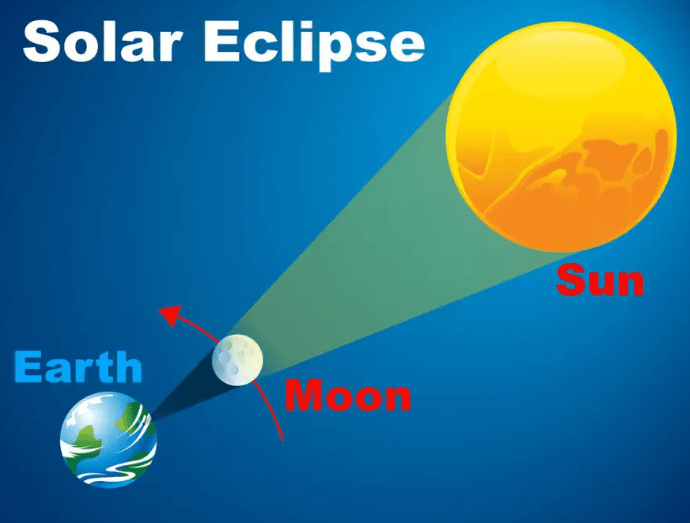
Describe the position of the Earth, Sun, and Moon during a solar eclipse.
400
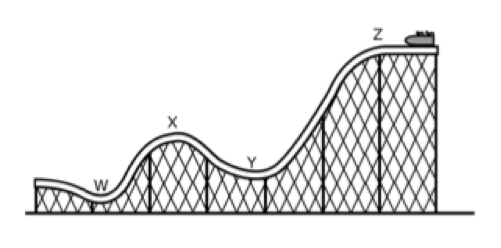 Identify which points have the highest kinetic energy and which have the highest potential energy.
Highest PE - Z
Highest KE - W
400
What are the 5 indications that a chemical reaction occured?
1. Color change
2. Temperature change
3. Precipitate formation
4. Light formation
5. Gas production
400
Students conducted an investigation about processes of the water cycle. They used four bowls containing water and salt to represent the ocean and collected data in the table below. Where did the most evaporation occur and why?
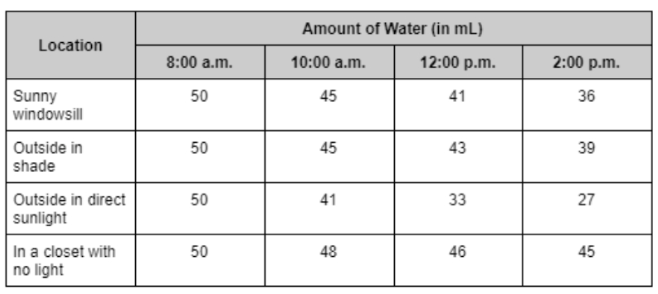
Outside in direct sunlight - least amount of water in the bowl.
500
In a forest, which would be more likely to survive and reproduce: a population of white rabbits or a population of brown rabbits? Explain your reasoning.
Brown rabbits - camouflaged
500
A map of average sea surface temperatures over the entire Earth is provided.
Warm water is less dense than cold water. Based on this information and the map provided, where would the sea level rise?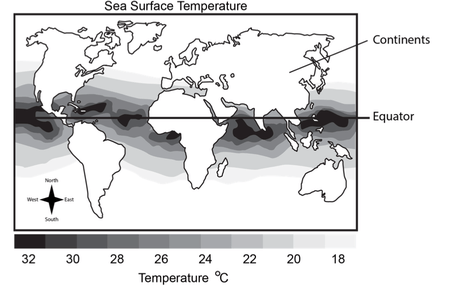
At the equator
500
Identify which phase is a full moon and which is a new moon.
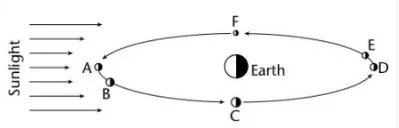
Full moon = D
New moon = A
500
Which pair do the spheres exert the greatest electrical force on each other and why?
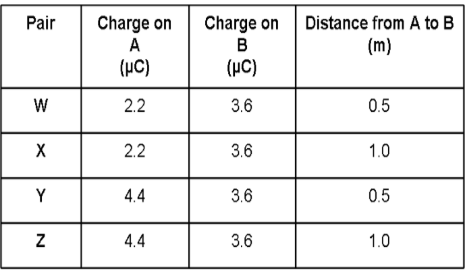
Pair Y - Greatest charge and closest distance
500
Does the following atomic model demonstrate the Law of Conservation of Matter? Why or why not?
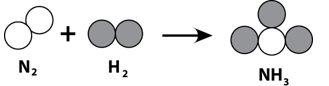
No!
Reactants - N = 2 , H = 2
Products - N = 1, H = 3
500
In the diagram of the water cycle below, describe which parts are driven by gravity.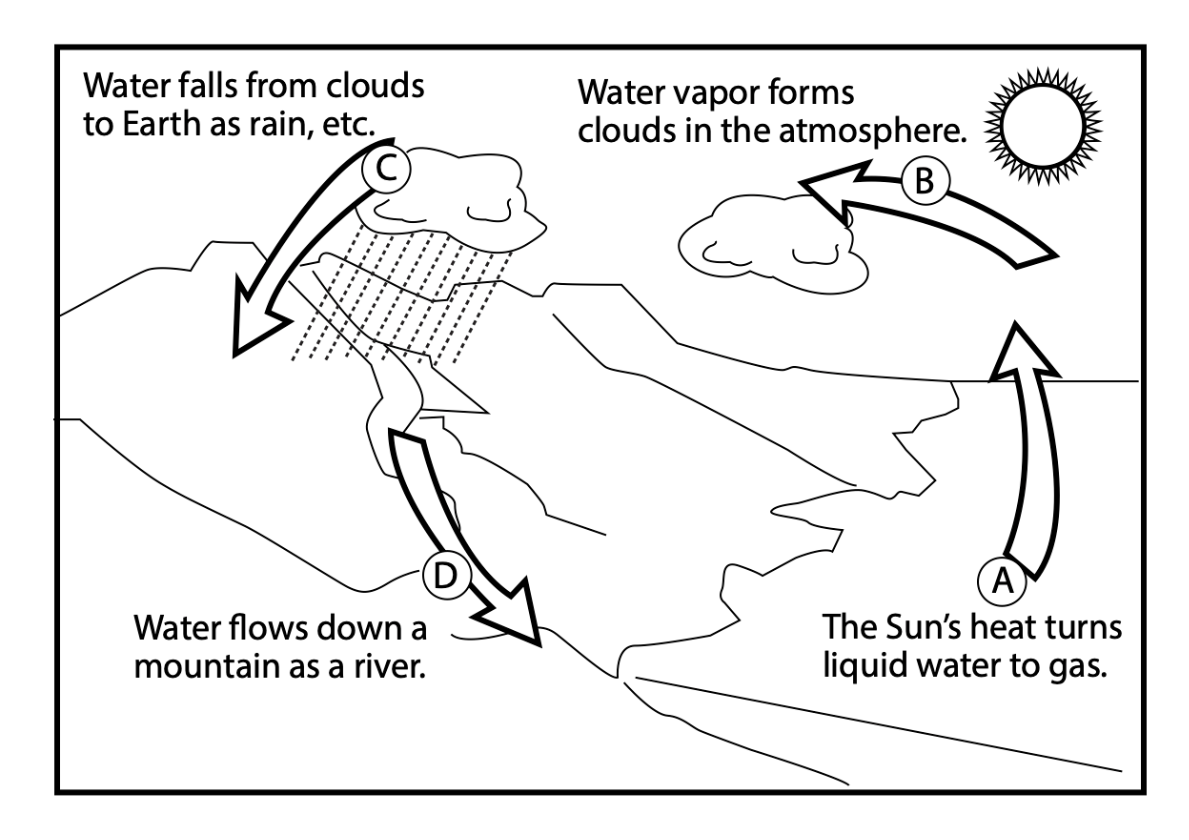
Water to fall from clouds
Water to flow downhill from higher ground to lower ground.
600
Which fossil would be used as a reference to determine the age of newly discovered fossils? Why?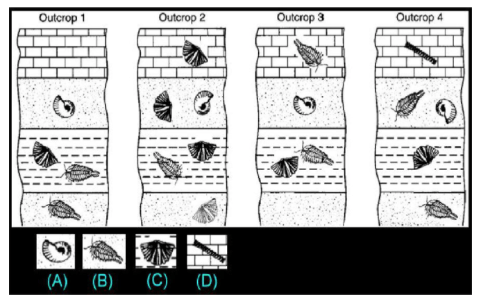
Fossil A - index fossil
Found in all four columns in the same layer, thus representing a wide geographic distribution.
600
Students planted 100 seeds in two different plots of land on the same day. Both plots of land measured 10 square meters. They recorded data for one year.
Based on the data, the taller height of the population of plant #2 is most likely the result of _____.
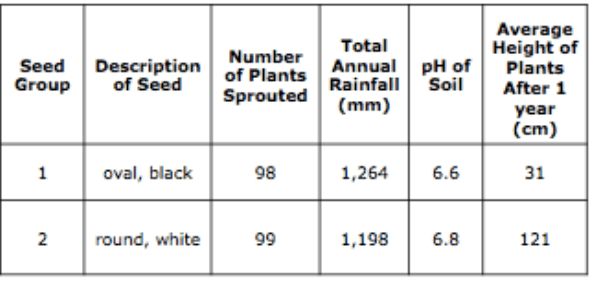
Genetic factors during reproduction.
600
We would observe a totally dark moon starting to become illuminated when the moon moves between which two phases?
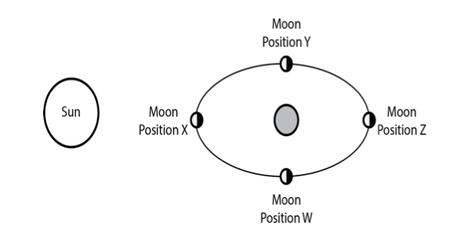
Position X to position Position W
600
What is the equation used to determine the amount of force exerted on an object (Newton's Second Law)?
F = M x A
600
Students are designing an experiment to test the law of conservation of mass using the following materials: 10 g baking soda, 30 mL vinegar, an electronic balance, and a resealable plastic bag. Describe the basic procedure the students should follow to model this law.
Measure the mass of all components separately (baking soda, bag, vinegar).
Then mix together to cause the chemical reaction.
Measure the materials again, and it should equal the same mass as it did before the reaction.
600
This weather map of the US shows the location of four cities and the direction of movement of four air masses. The data table gives the air pressure in the four cities.
Which air mass is demonstrating a flow of air from high to low pressure?
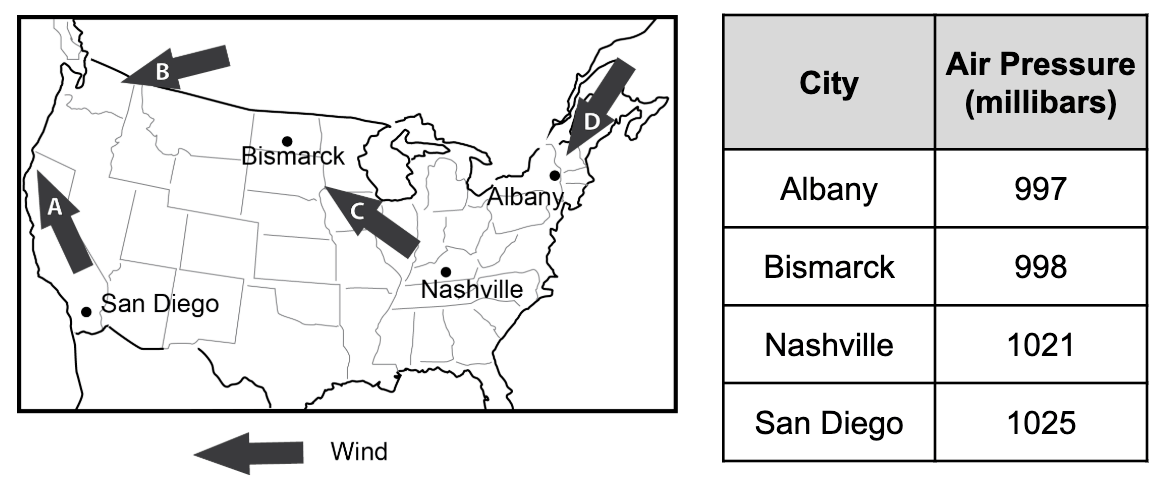
C