Dot Plots, Box Plots and Histograms
Shape of Distributions
Measures of Center and Variability
Vocabulary
Extreme Values
100
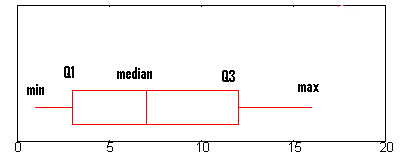
What is the five-number summary?
Minimum, First Quartile, Median, Third Quartile, Maximum
100
What is the shape of this distribution?
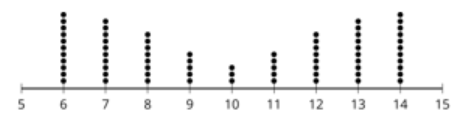
Symmetrical, bimodal graph
100
How do you find the Mean of a Data Set?
Add all of the numbers and divide by how many they are.
100
How do you find the Interquartile Range of a data set?
The IQR of a data set measures the spread of 50% (or the middle) of the data set. It is found by subtracting the first quartile (Q1) from the third quartile (Q3)
IQR = Q3 - Q1
100
If the data is symmetric, then the mean and median are _____________
Equal
200
True or False:
Dot plots show every piece of data
True. Every unique point is represented when plotted on a Dot Plot
200
How would you describe the shape of this distribution?
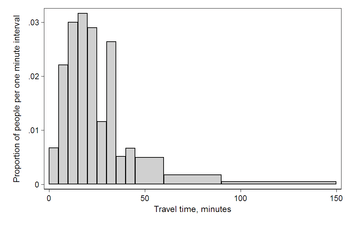
Skewed right
200
What are the two main measures of center?
Mean and median
200
True or False:
The smaller your standard deviation, the more consistent your data is around the mean
True. A smaller standard deviation means that the data is clustered more tightly around the mean. Therefore, there is less variability in your data set.
200
If the data is skewed right, then the mean is _____ than the median
Greater
300
How much percent of the data is in the Interquartile Range (IQR)?
50%. The IQR measures the middle of the data set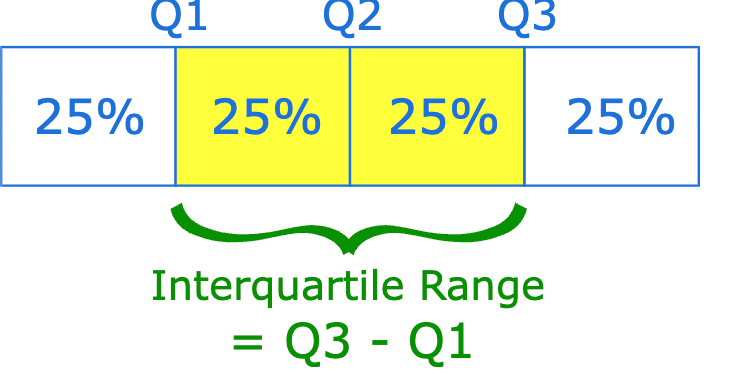
300
If we have a symmetrical distribution, we use the _______ as a measure of center and the ___________ as a measure of variability.
mean, standard deviation
300
What are the two main measures of variability?
IQR and Standard Deviation
300
True or False:
"Quartile 2" is the median of a data set
True. "Quartile 2" is another way to refer to the median of an entire data set
300
If the data is skewed left, then the mean is _____ than the median
less
400
If I wanted to find the mean of a data set, would I use a Dot plot or a Box plot?
A Dot Plot because a Box Plot shows you the median, not the mean
400
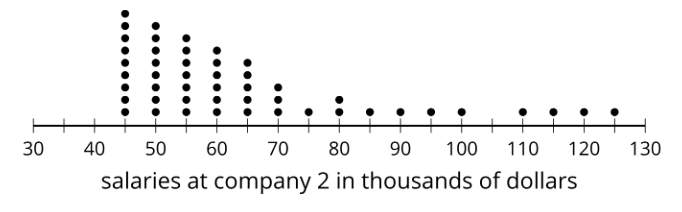
True or False:
The mean and median values of salaries shown in the dot plot are equal
False. The distribution is not symmetrical so the median ≠ mean.
400
What is the median of the following data set:
2, 4, 7, 2, 3, 8, 4, 5
The median is 4
400
True or False:
You can determine if a value is an outlier if it falls outside the range of:
Q1 - 1.5(IQR) and Q3 + 1.5(IQR)
True.
Any value less than Q1 - 1.5(IQR) is an outlier
Any value greater than Q3 + 1.5(IQR) is an outlier.
400
If we remove the value 16, what will happen to the mean and standard deviation?
4, 5, 10, 15, 16
The mean and standard deviation would decrease
500
True or False:
Histograms show the median of a set of data
False. Histograms only show you the frequency of the data
500
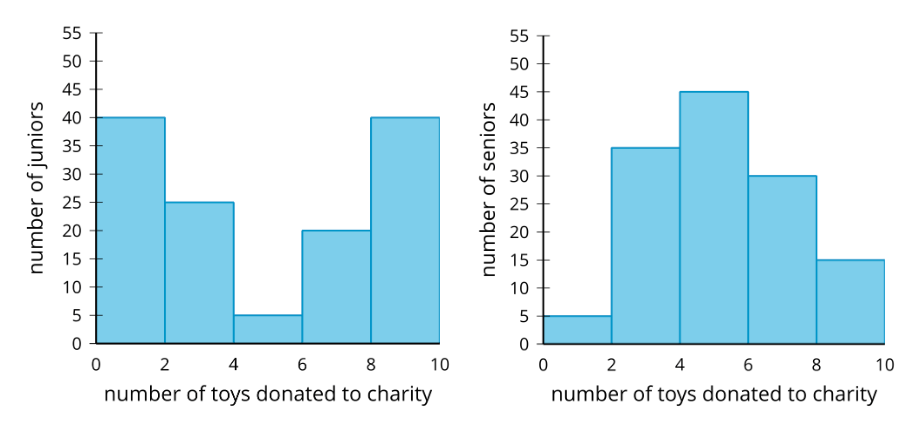
True or False:
The standard deviation of the number of toys donated from seniors is greater than that of juniors
False. The data for juniors is more spread out than it is for seniors which means juniors have a greater standard deviation.
500
How do you calculate the median?
Arrange numbers from smallest to largest, then find the middle number.
500
Arrange the dot plots from order of least to greatest variability
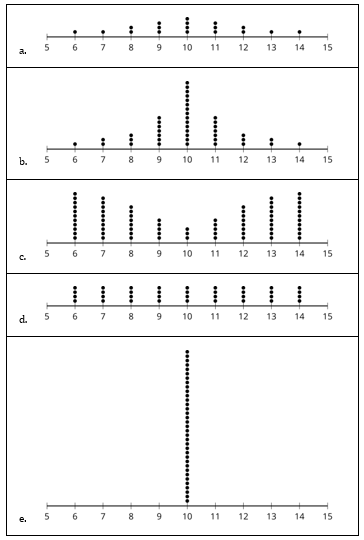
E, B, A, D, C
500
By adding the values 3 and 17 to the data, what would happen to the mean?
4, 5, 10, 15, 16
The mean would not change because adding 3 and 17 would balance the data